Another Higher High [Video]
![Another Higher High [Video]](https://editorial.fxstreet.com/images/Markets/Equities/display-stock-market-charts-23026797_XtraLarge.jpg)
US Dollar: Sept USD is Up at 96.716.
Energies: Aug '19 Crude is Up at 59.83.
Financials: The Sept 30 year bond is Up 4 ticks and trading at 154.06.
Indices: The Sept S&P 500 emini ES contract is 8 ticks Higher and trading at 3019.50.
Gold: The Aug Gold contract is trading Up at 1417.00. Gold is 35 ticks Higher than its close.
Initial Conclusion
This is not a correlated market. The dollar is Up+ and Crude is Up+ which is not normal and the 30 year Bond is trading Higher. The Financials should always correlate with the US dollar such that if the dollar is lower then bonds should follow and vice-versa. The S&P is Higher and Crude is trading Higher which is not correlated. Gold is trading Higher which is not correlated with the US dollar trading Up. I tend to believe that Gold has an inverse relationship with the US Dollar as when the US Dollar is down, Gold tends to rise in value and vice-versa. Think of it as a seesaw, when one is up the other should be down. I point this out to you to make you aware that when we don't have a correlated market, it means something is wrong. As traders you need to be aware of this and proceed with your eyes wide open.
Currently Asia is trading Mixed at the present time. All of Europe is trading Higher at this time.
Possible Challenges To Traders Today
-
FOMC Member Bowman Speaks at 8:15 AM EST. This is major.
-
Core Retail Sales m/m is out at 8:30 AM EST. This is major.
-
Retail Sales m/m is out at 8:30 AM EST. This is major.
-
Import Prices m/m is out at 8:30 AM EST. This is major.
-
Capacity Utilization Rate is out at 9:15 AM EST. This is major.
-
Industrial Production m/m is out at 9:15 AM EST. This is major.
-
Business Inventories m/m is out at 10 AM EST. This is not major.
-
NAHB Housing Market Index is out at 10 AM EST. This is major.
-
Fed Chair Powell Speaks at 1 PM EST. This is major.
-
FOMC Member Evans Speaks at 3:30 PM EST. This is major.
-
TIC Long-Term Purchases is out at 4 PM EST. No effect on the session.
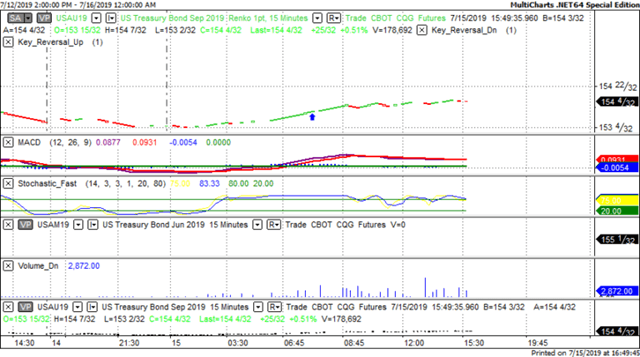
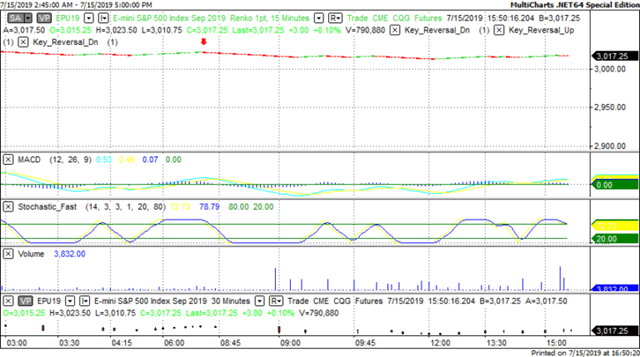
Treasuries
We've elected to switch gears a bit and show correlation between the 30 year bond (ZB) and The YM futures contract. The YM contract is the DJIA and the purpose is to show reverse correlation between the two instruments. Remember it's liken to a seesaw, when up goes up the other should go down and vice versa.
Yesterday the ZB made a major move at around 8 AM EST. The ZB hit a Low at around that time and the YM hit a High. If you look at the charts below ZB gave a signal at around 8 AM EST and the YM was moving Lower at the same time. Look at the charts below and you'll see a pattern for both assets. ZB hit a Low at around 8 AM and the YM was moving Lower at the same time. These charts represent the newest version of MultiCharts and I've changed the timeframe to a 15 minute chart to display better. This represented a Long opportunity on the 30 year bond, as a trader you could have netted about 10 ticks per contract on this trade. Each tick is worth $31.25. Please note: the front month for both the ZB and YM contract is now September, 2019 and I've changed the format to Renko bars such that it may be more apparent and visible.
Bias
Yesterday our bias was to the Upside and the markets kept its winning ways. The Dow rose by 27 points and the other indices gained ground as well. Today we aren't dealing with a correlated market and our bias is Neutral.
Could this change? Of Course. Remember anything can happen in a volatile market.
Commentary
Remarkably the markets moved to a higher high once again. The Dow gained 27 points and the other indices moved higher as well. Now conventional wisdom would say that the markets should have move lower today. After all didn't the market crack all time highs on Friday. Didn't the Dow advance 244 points and the other indices as well? We take a different view. Each and every day we view the markets as we see them for that day. We make no assumptions and use Market Correlation to determine direction. Are we right 100 percent of the time? Anyone who says they are should be held as suspect. As we say each and every day "this too can change".
Author

Nick Mastrandrea
Market Tea Leaves


