An Intraday Power Curve

Thursday September 13th, 2018, active trading in the S&P eMini switched to trading the December contract. How would it behave?
This chart shows the power curve produced by price, as detected by my FibGrowth emylar overlay from the forthcoming course, "The Secret Math of Power Curves."
This chart coveres a 24 hour session as marked at A and B. Note the times are in MDT (C) on the chart.
The powercurve overlay has a 360 degree horizontal axis. For the first half of this "cycle," The curves is essentially flat. This portion was overlayed on the cluster of moving averages. I found that half a cycle, 180 degrees, ined up with the 8 hour point of the session (D).
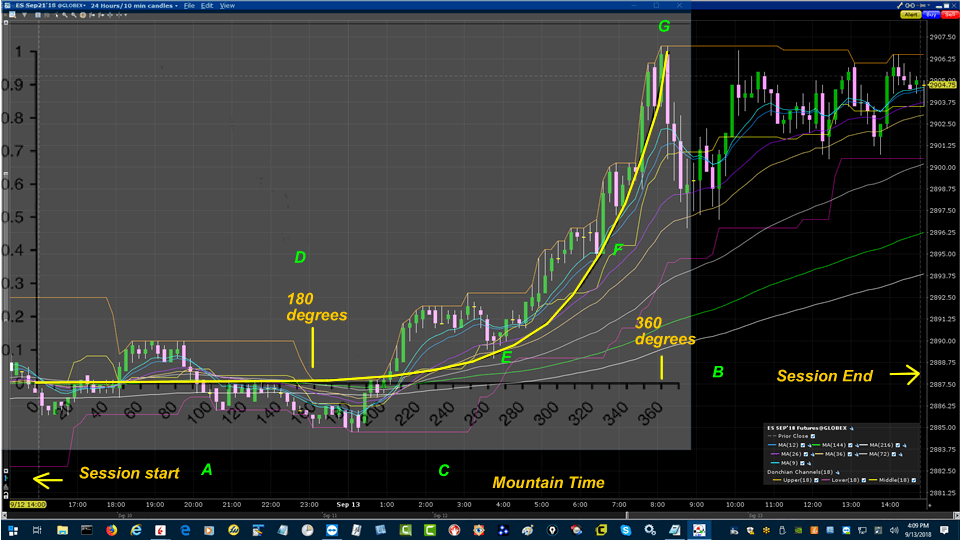
At the 270 degree point of the cycle, there was a dip at E. This was the first point that found support on the power curve. After finding this point I could stretch the overlay to estimate the end of the curve. This is an ongoing process, adjusted as more data became available.
At F prices felt the full impact of the addition of energy. Aligning this point estimated the top at point G. This was confirmed by the big down candle just after G.
That point indicated the high was in. The rest of the day was a consolidation between the high and the 50% retracement of the power curve.
So there was 8 hours of flat, 8 hours of a chaotic non-linear FibGrowth power curve, followed by 8 hours of cyclic congestion. The day was divided into harmonic thirds. The first and last third were linear, where Gaussian statistics apply. The center third was non-linear, where Paretian statistics apply. Learn more in the Cash In On Chaos Course at Moneytide.com
This content was published on Dr. Al Larson's Chaos Clinic which you can attend each Friday for free.
Dr. Al Larson has developed a complete Chaos Model of Markets, four unique courses that let you become a Certified Chaos Trader, some very unique eMylar fractal pattern overlays, and tools that permit forecasting individual stocks and markets years in advance. You can also sign up for a free weekly email, and attend a free Chaos Clinic on Fridays. To learn more, click on the author's profile.
Be sure to sign up for the free weekly email!
Author

Dr. Al Larson, PhD
MoneyTide.com
Dr. Al Larson holds a Ph.D. in Electrical and Computer Engineering from the University of Wisconsin. He is a 1964 Distinguished Graduate of the U. S. Air Force Academy.


