Amazon Buys Whole Foods

Good Morning Traders,
As of this writing 4:10 AM EST, here’s what we see:
US Dollar: Jun. USD is Up at 96.905.
Energies: Jul Crude is Down at 44.81.
Financials: The Sept 30 year bond is Up 5 ticks and trading at 155.25.
Indices: The June S&P 500 emini ES contract is 28 ticks Higher and trading at 2438.00.
Gold: The Aug gold contract is trading Down at 1251.30. Gold is 52 ticks Lower than its close.
Initial Conclusion
This is not a correlated market. The dollar is Up+ and crude is Down- which is normal and the 30 year bond is trading Higher. The Financials should always correlate with the US dollar such that if the dollar is lower then bonds should follow and vice-versa. The indices are Up and Crude is trading Down- which is correlated. Gold is trading Down- which is correlated with the US dollar trading Up+. I tend to believe that Gold has an inverse relationship with the US Dollar as when the US Dollar is down, Gold tends to rise in value and vice-versa. Think of it as a seesaw, when one is up the other should be down. I point this out to you to make you aware that when we don’t have a correlated market, it means something is wrong. As traders you need to be aware of this and proceed with your eyes wide open.
At this hour all of Asia is trading Higher. All of Europe is trading Higher at this hour.
Possible Challenges To Traders Today
– FOMC Member Dudley Speaks at 8 AM EST. This is major.
– Lack of major economic news.
Treasuries
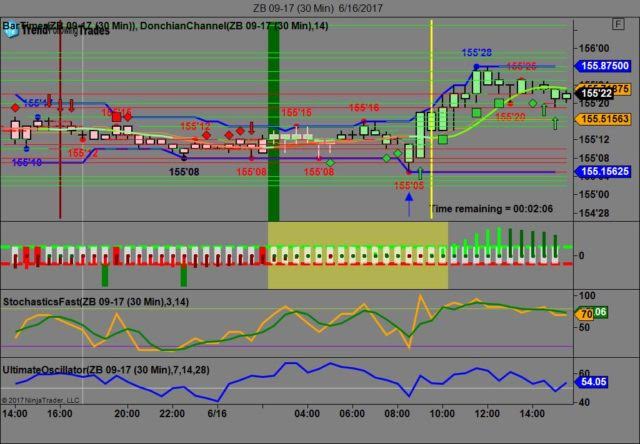
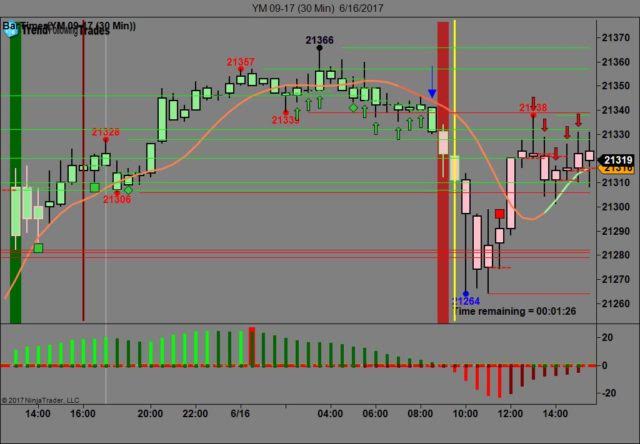
We’ve elected to switch gears a bit and show correlation between the 30 year bond (ZB) and The YM futures contract. The YM contract is the DJIA and the purpose is to show reverse correlation between the two instruments. Remember it’s liken to a seesaw, when up goes up the other should go down and vice versa.
On Friday the ZB made it’s move at around 8:30 AM EST after the 8:30 AM economic news was reported. The ZB hit a low at around that time and the YM hit a high. If you look at the charts below ZB gave a signal at around 8:30 AM and the YM was moving lower at the same time. Look at the charts below and you’ll see a pattern for both assets. ZB hit a low at around 8:30 AM and the YM hit a high. These charts represent the newest version of Trend Following Trades and I’ve changed the timeframe to a 30 minute chart to display better. This represented a long opportunity on the 30 year bond, as a trader you could have netted about 20 plus ticks per contract on this trade. Each tick is worth $31.25. We added a Donchian Channel to the charts to show the signals more clearly. Please note that the front month for the ZB contract is now September, 2017.
Charts Courtesy of Trend Following Trades built on a NinjaTrader platform.
Bias
On Friday we gave the markets an upside bias as the USD and the Bonds were all trading lower Friday morning. The Dow gained 24 points, the S&P closed flat and the Nasdaq dropped 14 points. Today we aren’t dealing with a correlated market and our bias is neutral.
Could this change? Of Course. Remember anything can happen in a volatile market.
Commentary
The news of the day on Friday was the mega-merger between Amazon and Whole Foods Markets. Amazon is of course the leading online etailer and Whole Foods Markets is a leader in providing healthy foods to the general public via supermarket type stores. The question is could this work? In certain ways it can. Imagine placing an online order for food at Whole Foods and picking it up without having to go thru checkout as your order is already paid for. Will the prices go down? Probably not as Amazon will want to recoup the capital to but Whole Foods Markets but no one can deny that it will be more convenient. Before we go haywire on tis just recall that in 2000 AOL purchased Time Warner and everyone thought that was going to be a major game changer and as it turned out, it wasn’t. Time will tell if Amazon can make this work.
Author

Nick Mastrandrea
Market Tea Leaves


