All that glitters is not Gold

S2N spotlight
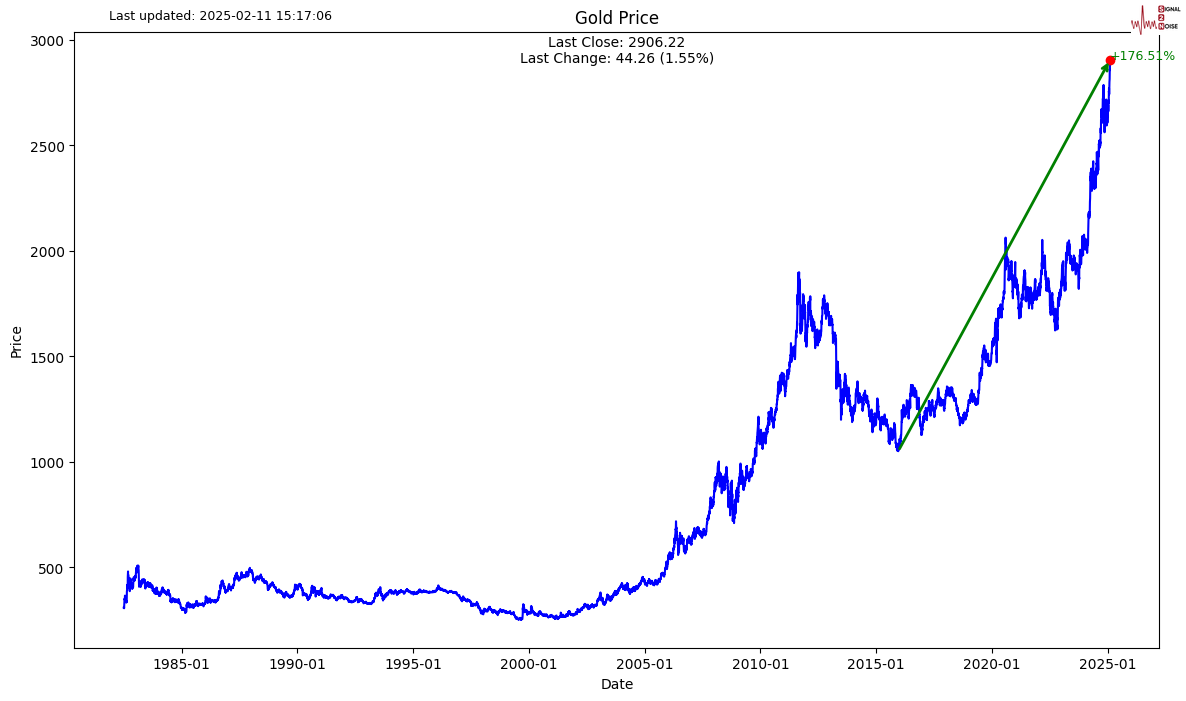
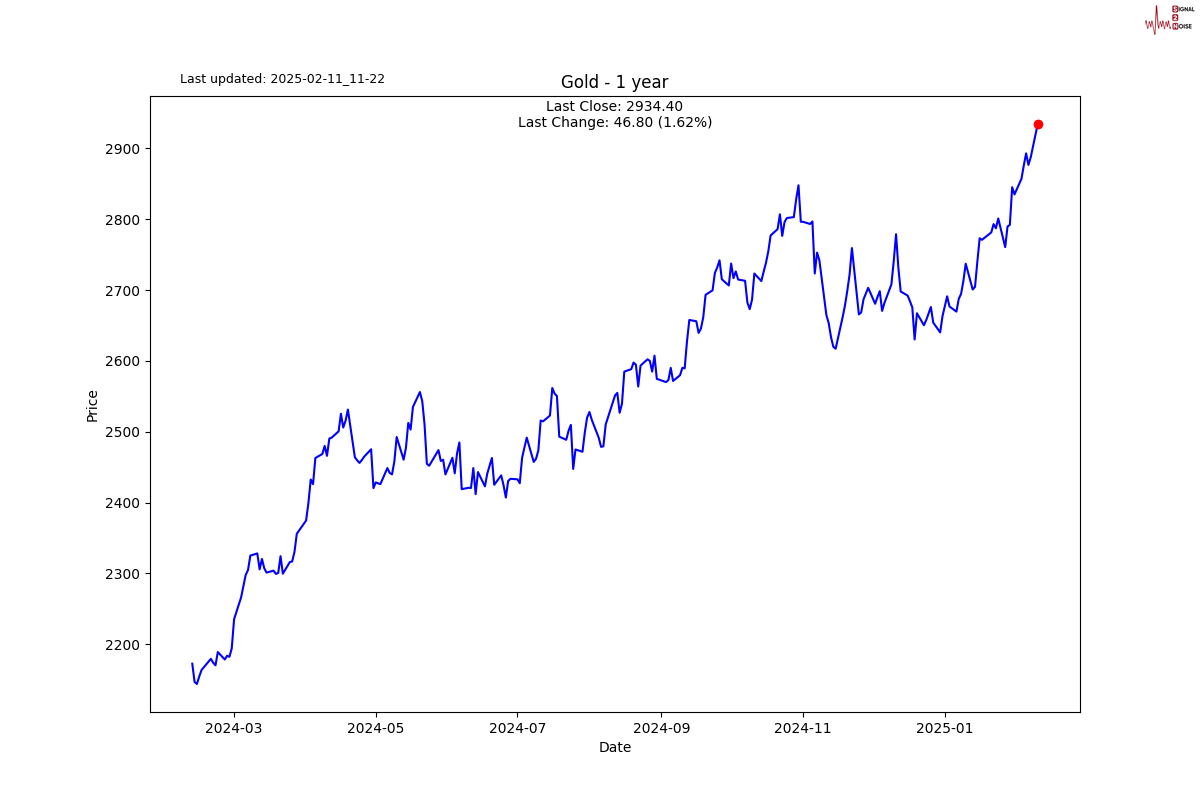
Gold makes another all-time high with what appears to be an urgent run at 3000.
Before we spotlight gold, we need to realise that when it is racing higher, it usually means there are problems in the economy, as gold's main purpose is a safe haven store of wealth. But today we will leave the negative stuff for another time.
Let me set the scene with some pictures.
Since the lows of 10 years ago, gold has risen 176%.
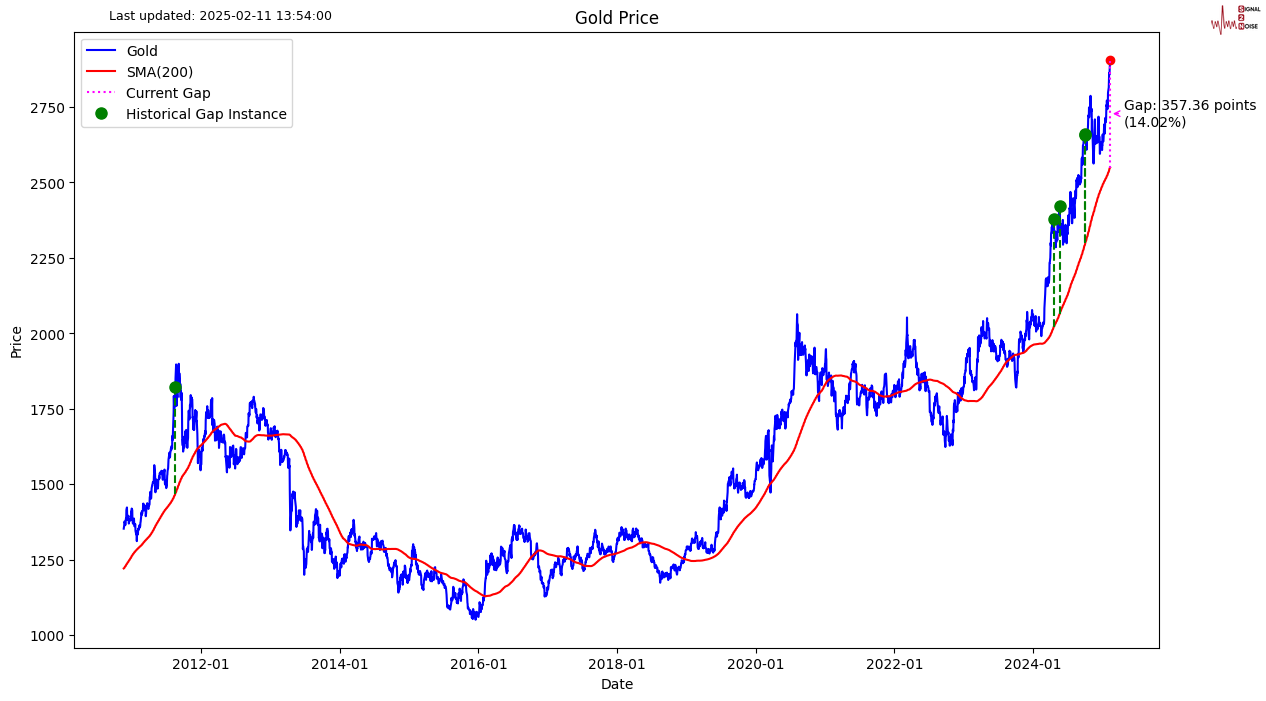
There is currently a gap of 14% between gold and its 200-day simple moving average. This has only happened 4 other times in more than 45 years of data I have.
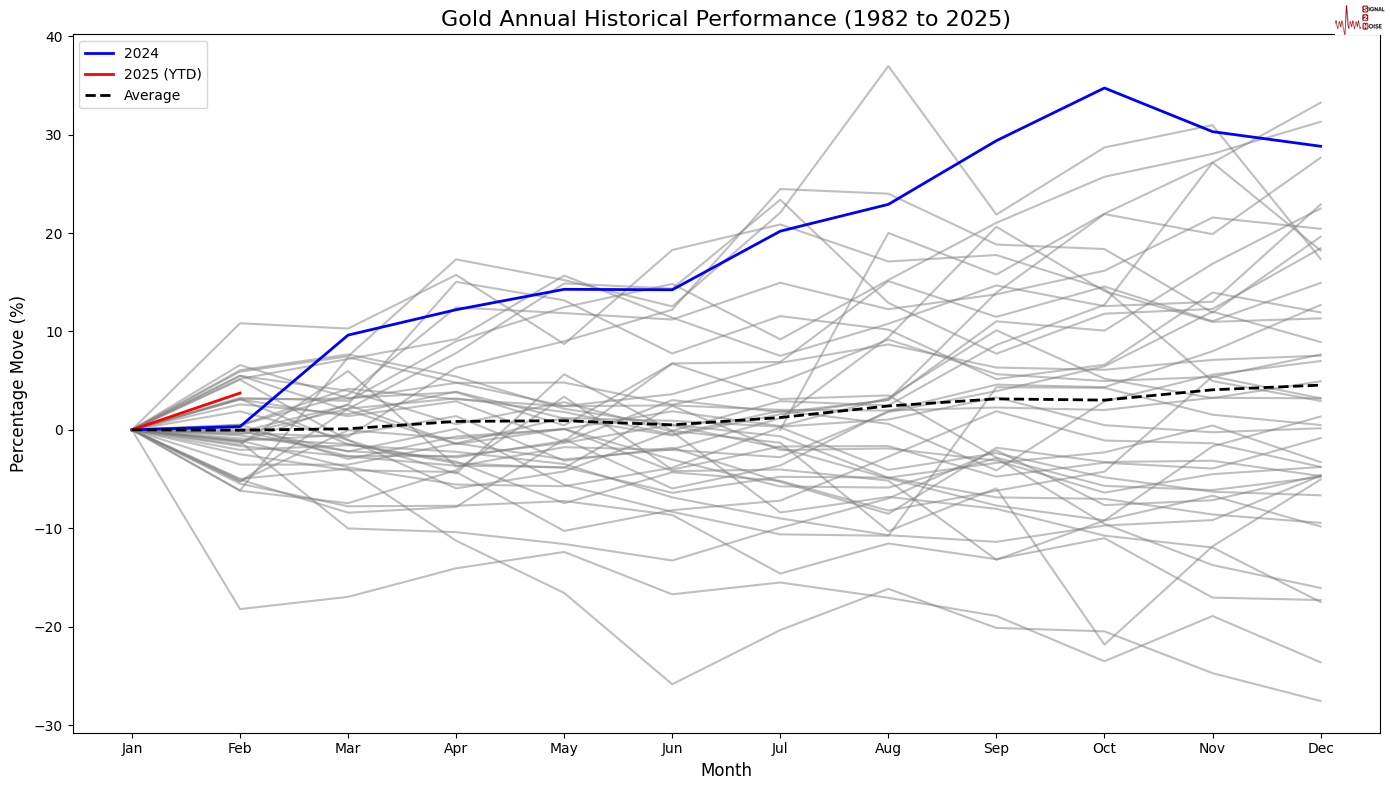
What there is more. If you look at the blue line, last year was almost a record calendar year, the 3rd best of all time. The red line for 2025 year-to-date is above last year and the long-term average. Let us see how this year pans out, I will keep you posted.
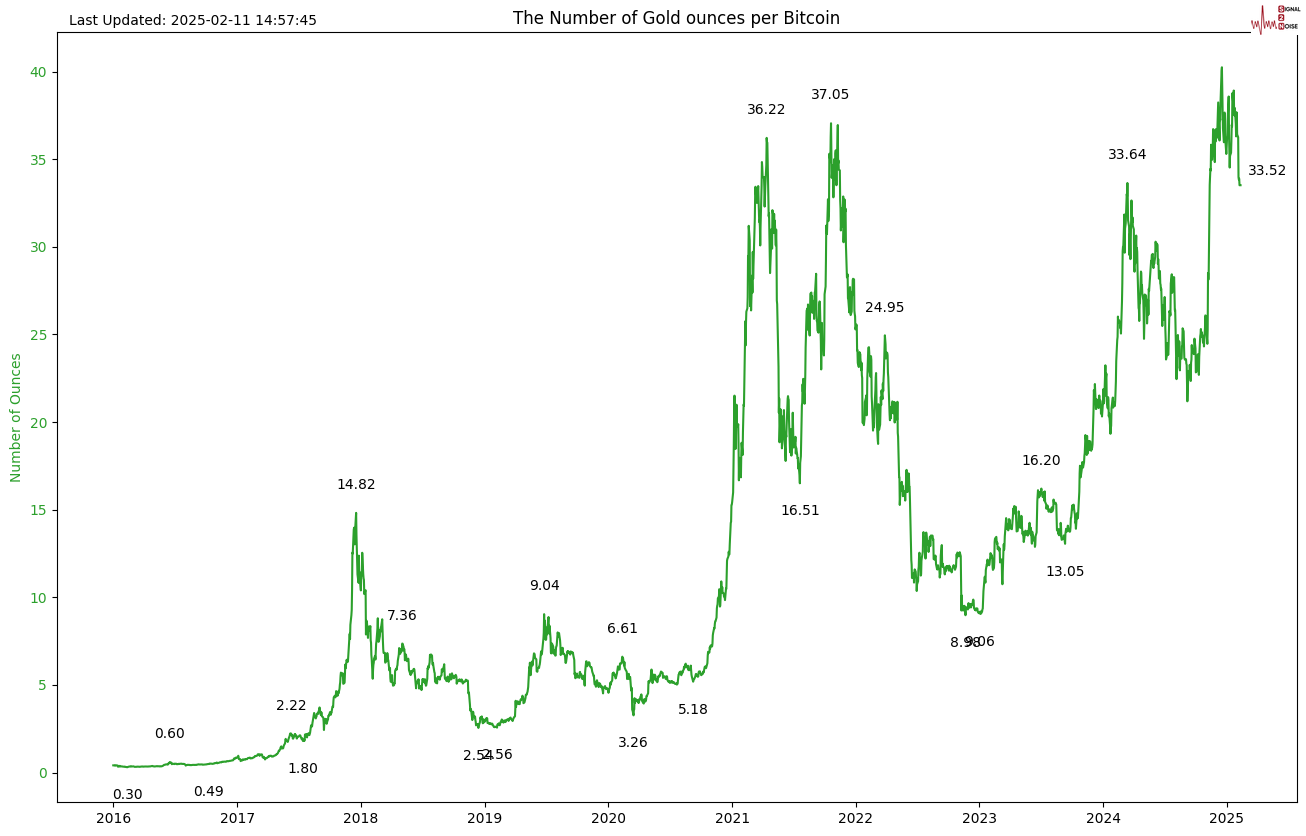
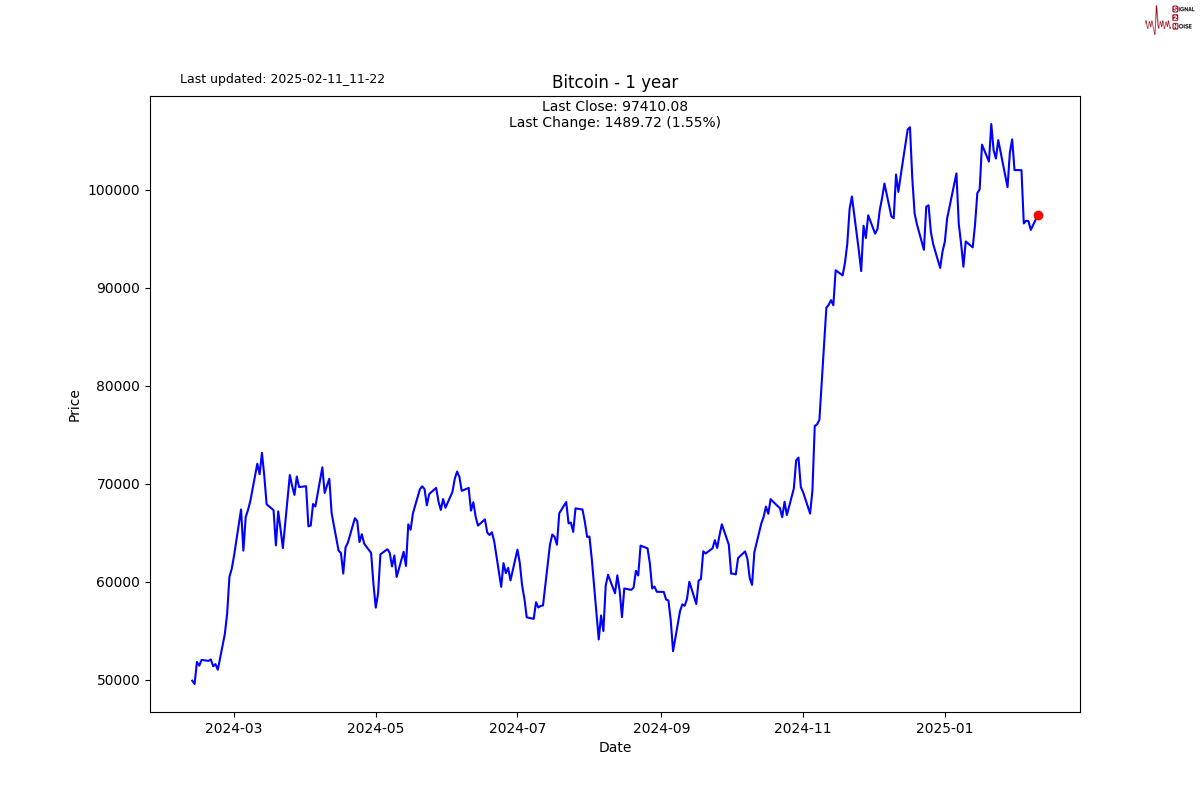
Just to put a lid on all the gold excitement. There has been another "safe haven" that has performed even better than gold. However, gold is currently making a relative comeback against bitcoin, with only 33 ounces of gold to a bitcoin, versus 40 in early January. 2025 will be an interesting one to watch which asset class is crowned king.
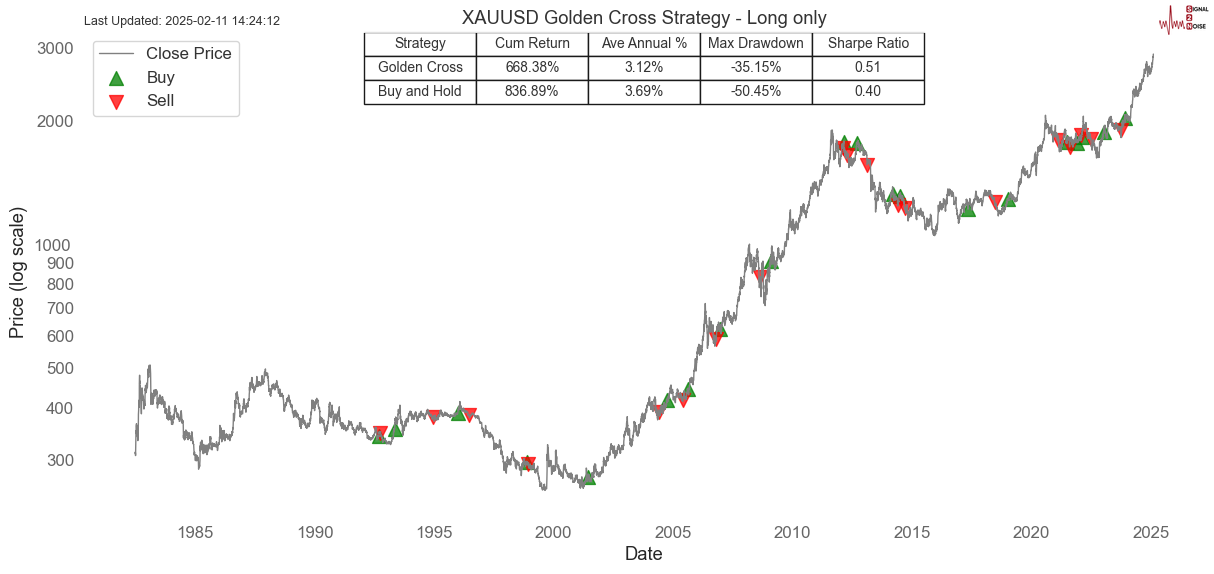
With all that glitter out of the way, I wanted to look at the classic Gold Cross Strategy and see what it is telling us. Remember, the gold cross is a buy when the 50-day moving average is above the 200-day moving average and a sell when it is below.
The first strategy I highlight is a "long only". This means when the strategy gives a sell signal, we move to cash. The strategy outperforms on a risk-adjusted Sharpe ratio. I don't focus on cumulative returns. I always focus on risk-adjusted returns.
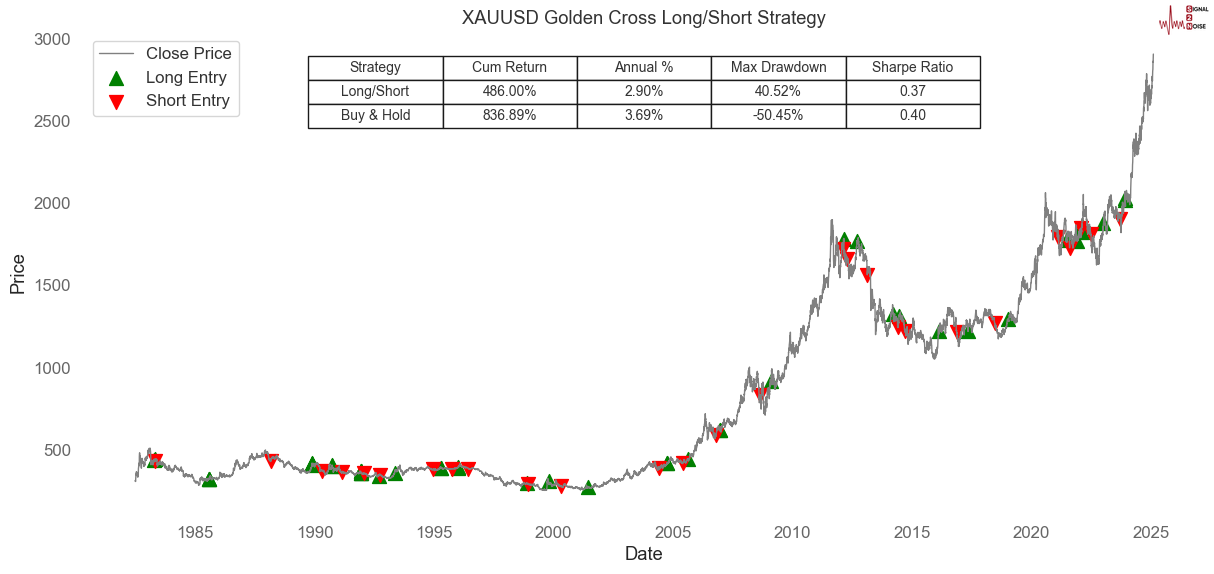
You are probably thinking, Why long only? Why not long/short? It turns out that with the 45 years of data we have, the Golden Cross Long/Short Strategy has not beaten Buy & Hold.
S2N observations
You have probably heard that Elon Musk and some buddies put in a bid of $97 billion to buy OpenAI. In response, Altman posted on Musk’s X social-media platform: “No thank you, but we will buy twitter for $9.74 billion if you want.”
I love it. Gloves off and ready to rumble. I think Altman is in for the fight of his life. Not sure he can go toe to toe with Musk without doing himself some serious damage.
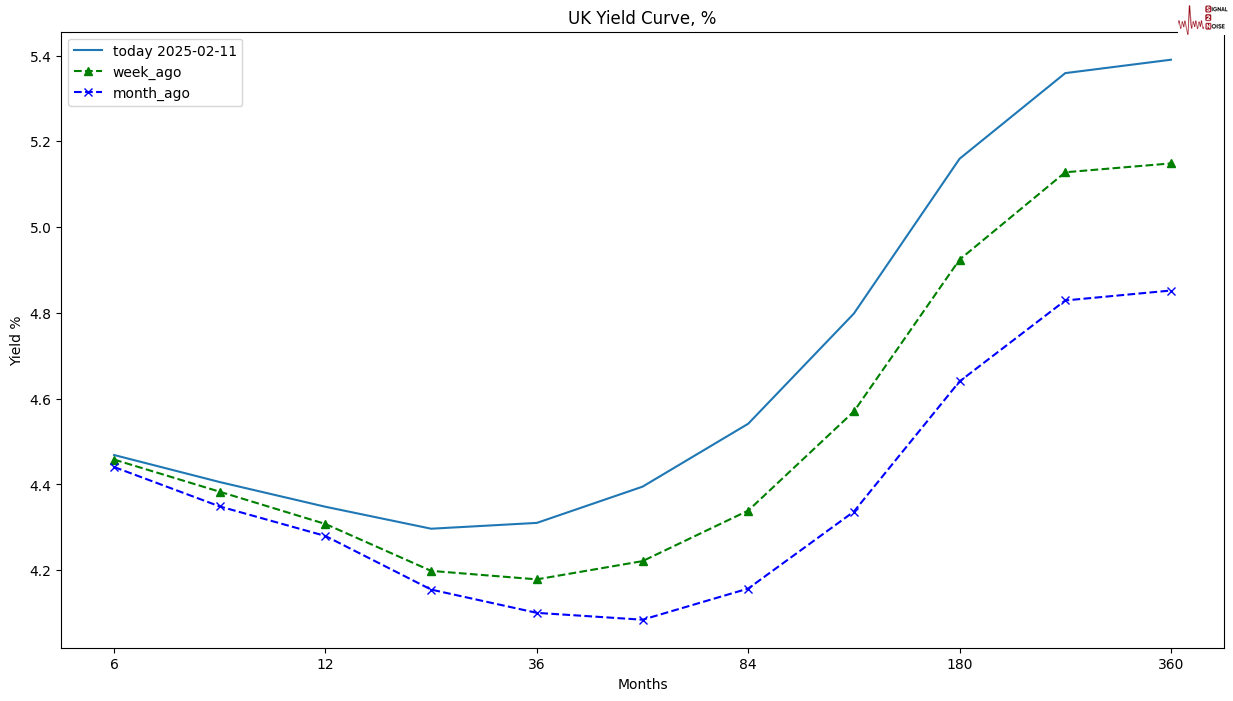
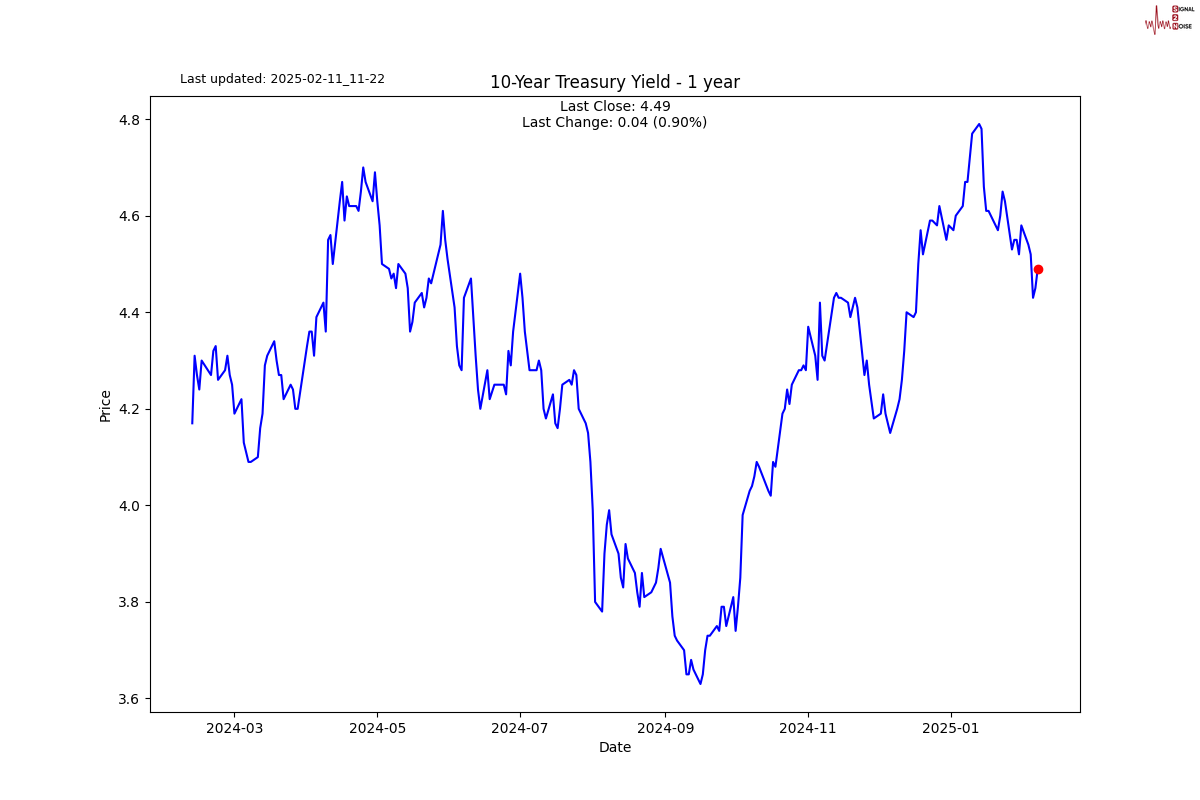
As you probably know, the Bank of England reduced rates last week. While the short-term rates may be dropping, the long end is actually rising.
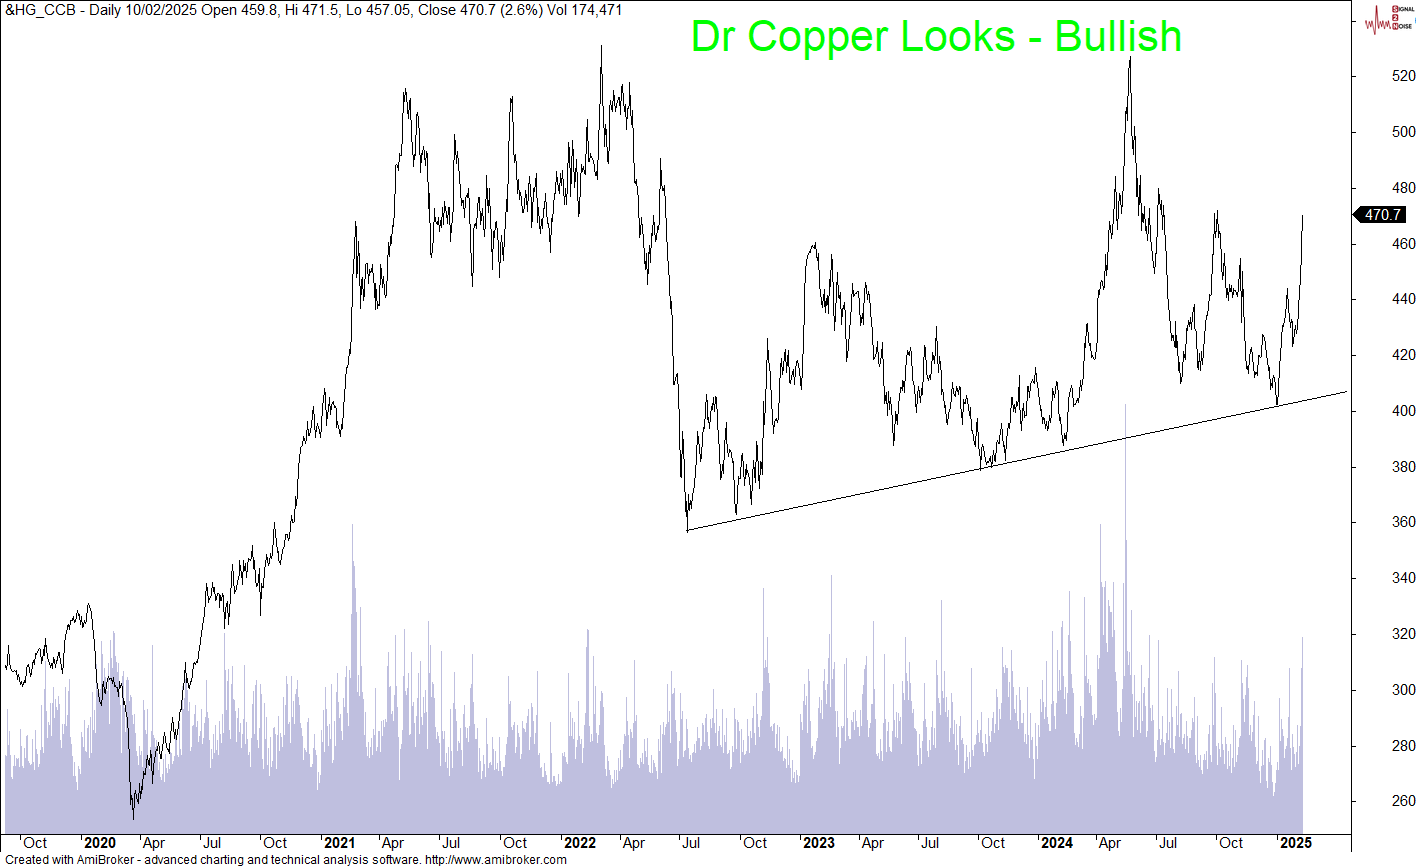
I am keeping an eye on Dr. Copper; it seems to want to go higher. In the old days, they used to say that it was a good lead indicator for the economy. I best add that to my to-do list and see if there is any signal or is it noise.
S2N screener alerts
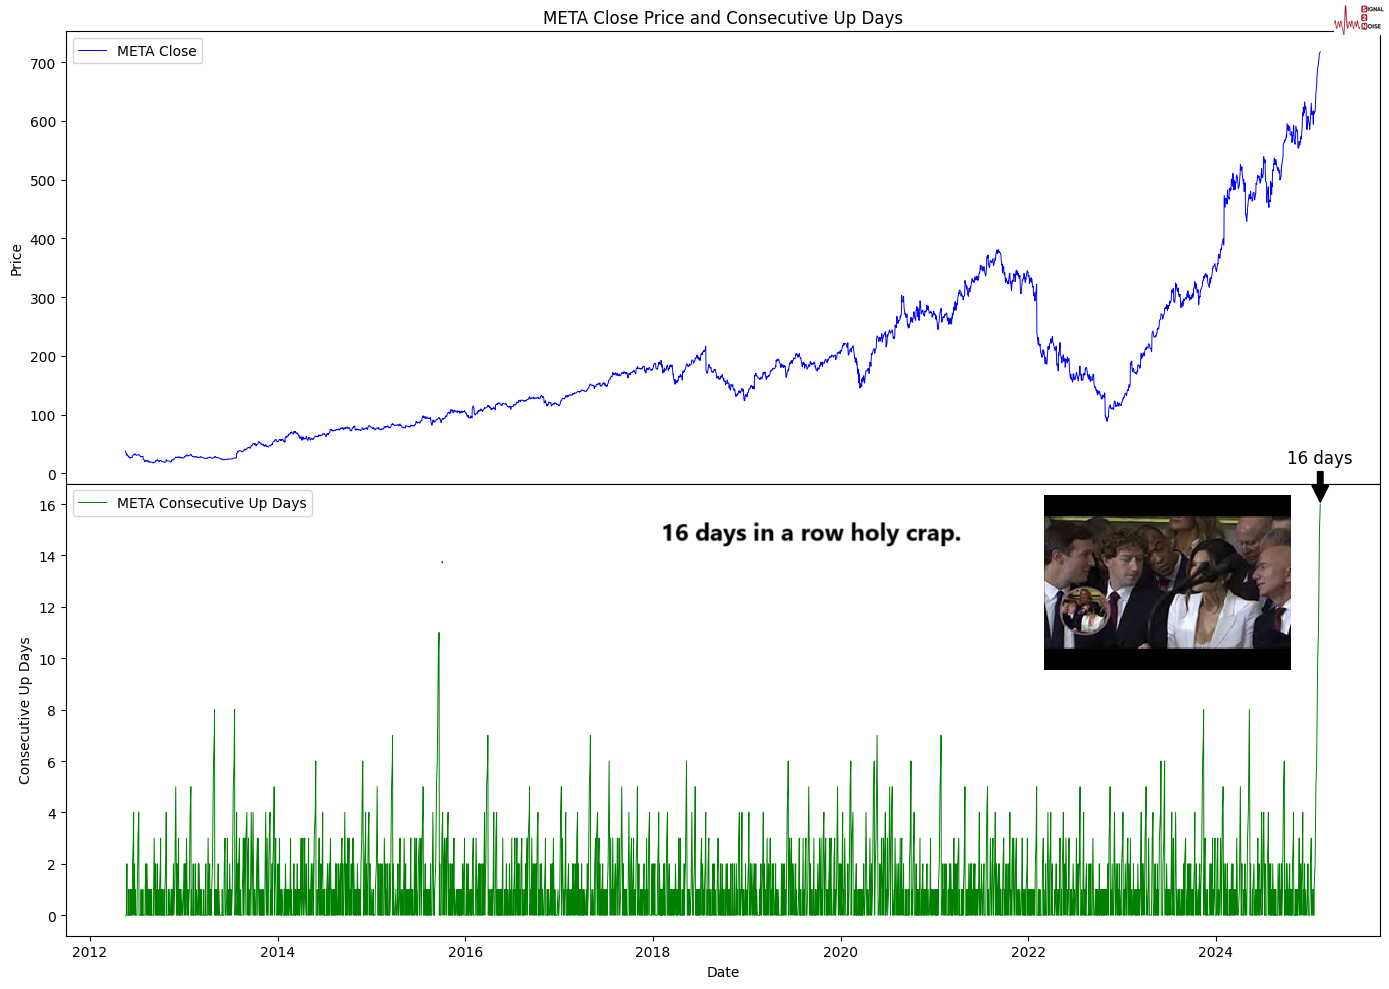
Holy Crap 16 days, and the stock is still rising for a new META record-up day streak.
Performance review
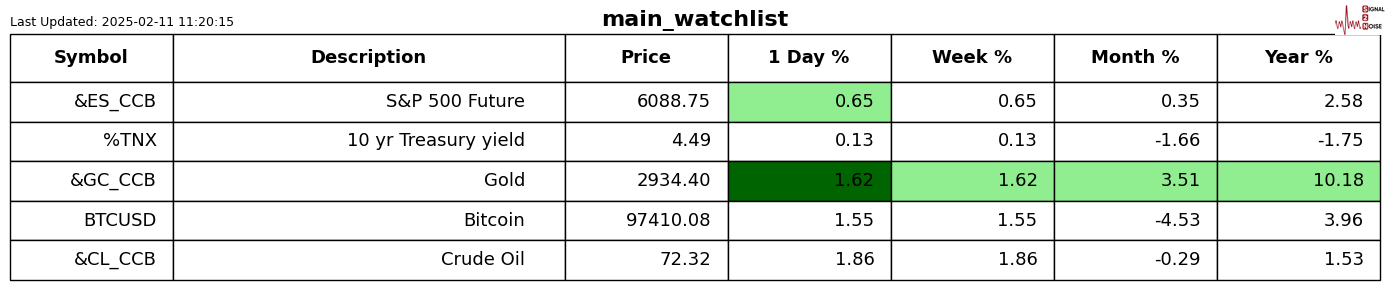
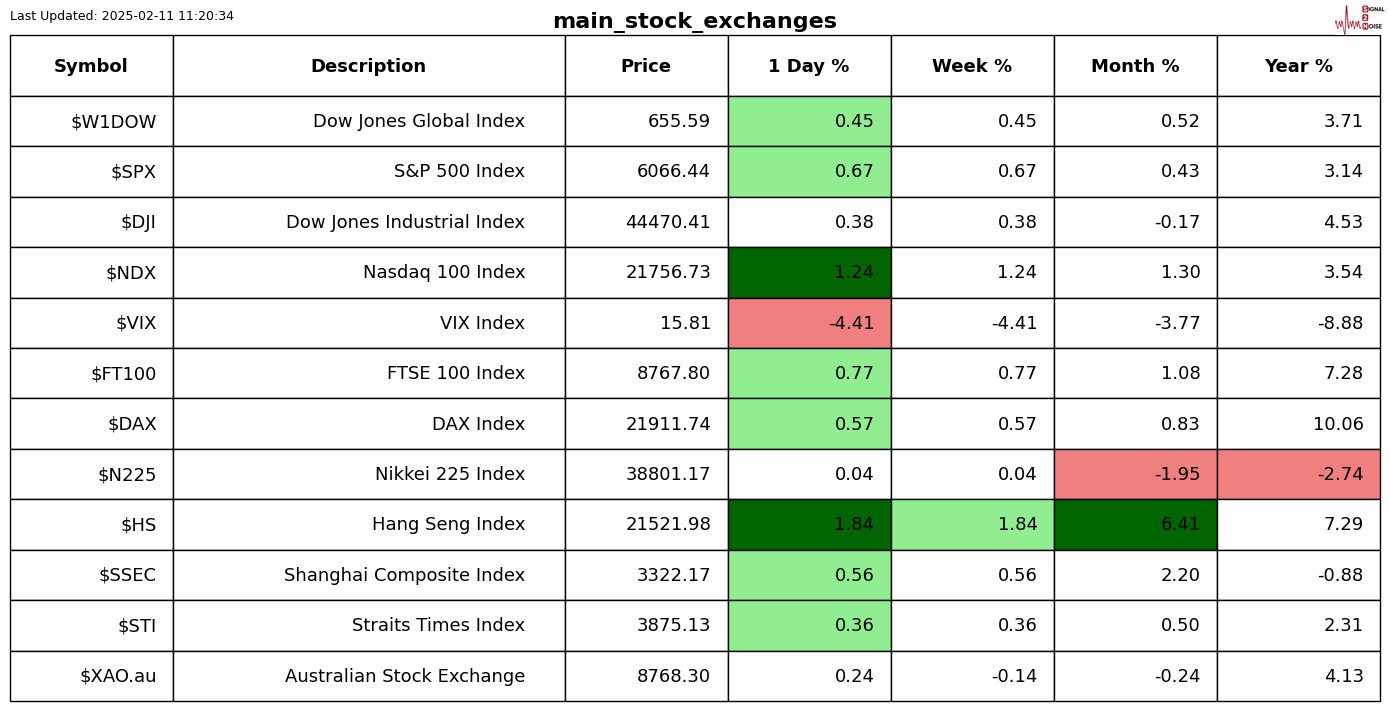
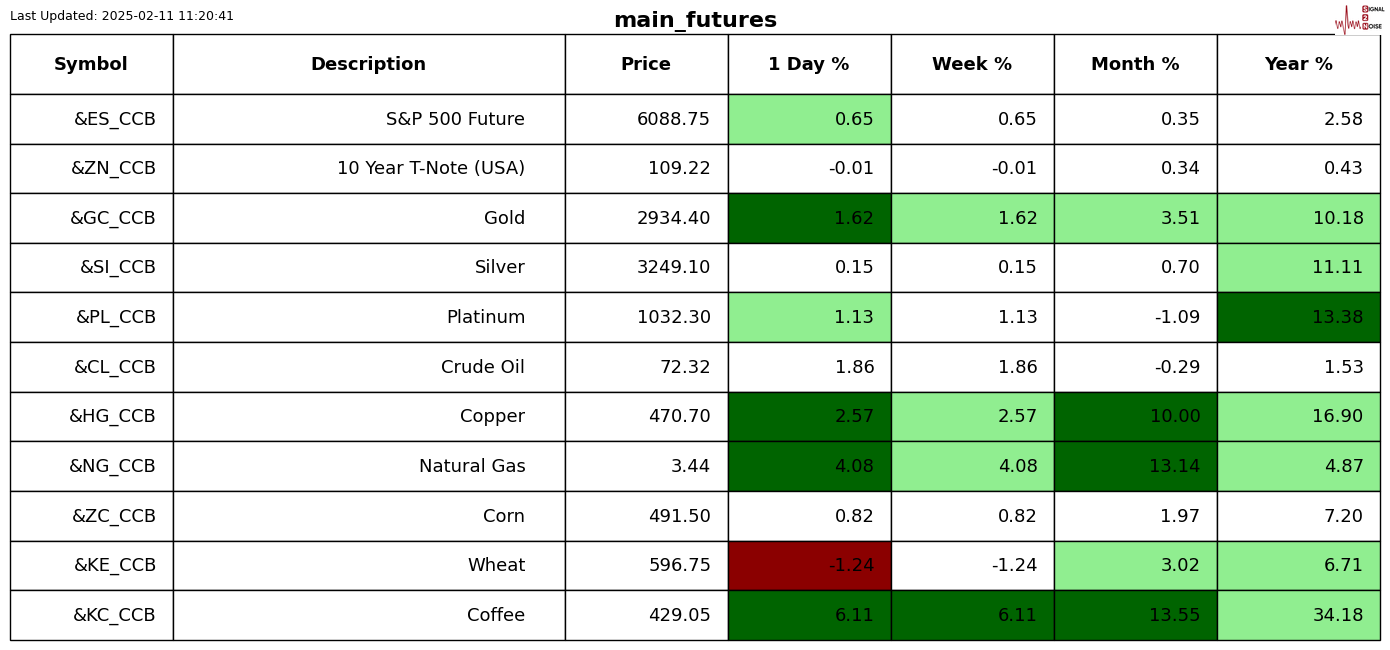
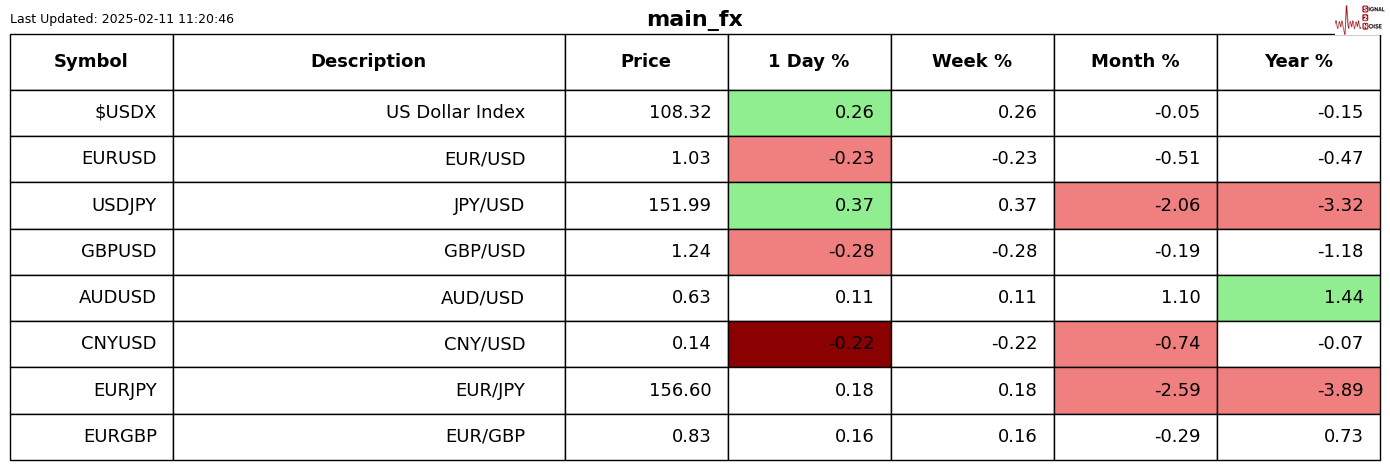
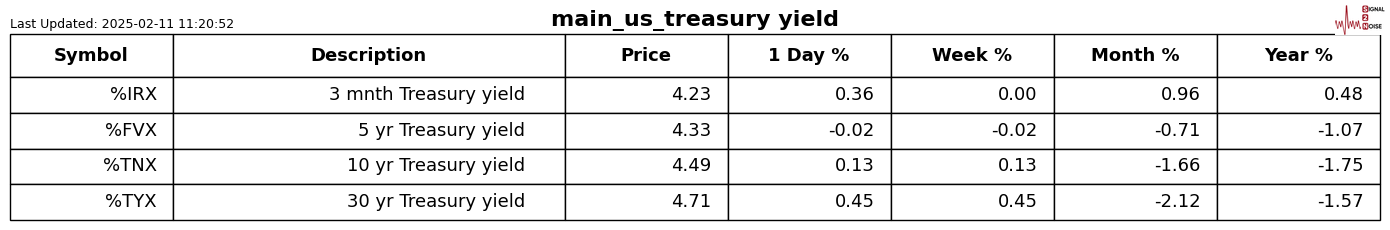
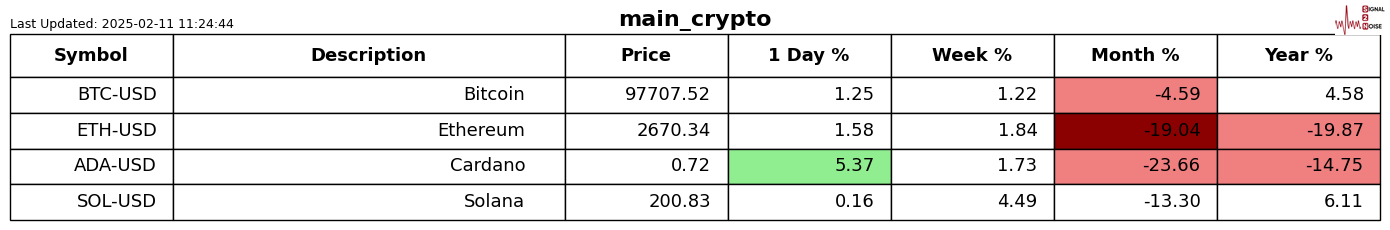
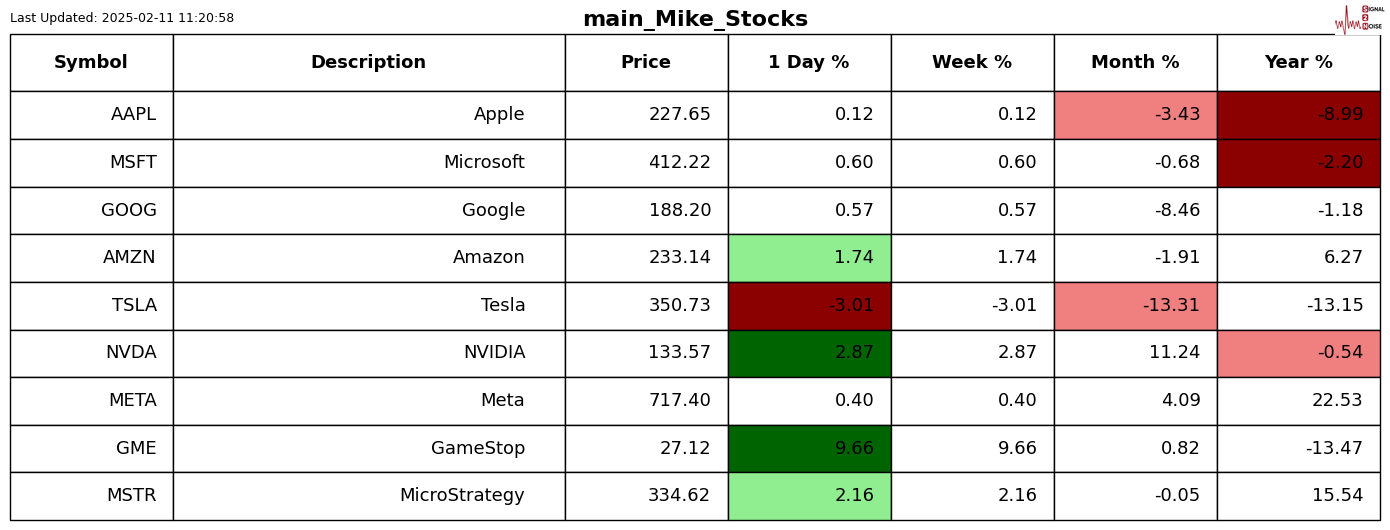
For those who are new to the letter, the shading is Z-Score adjusted so that only moves bigger than usual for the symbol are highlighted.
Chart gallery
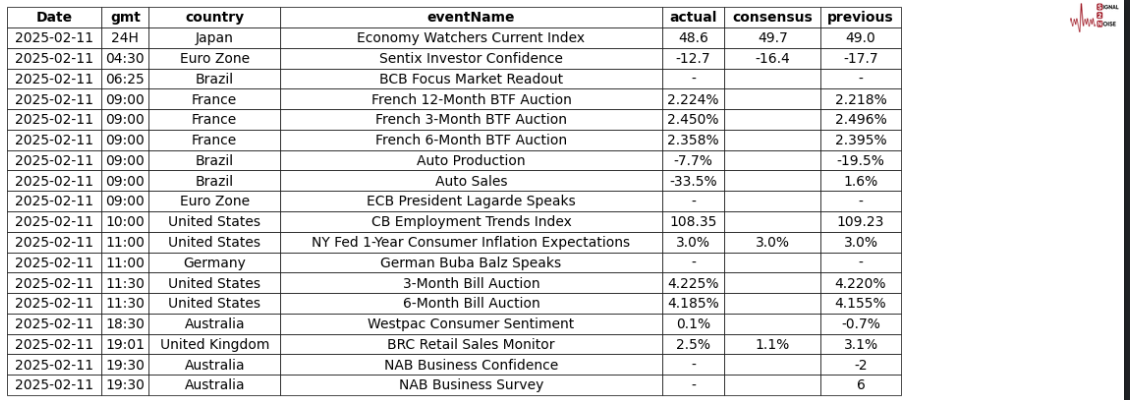
News today
Author

Michael Berman, PhD
Signal2Noise (S2N) News
Michael has decades of experience as a professional trader, hedge fund manager and incubator of emerging traders.


