A stable look at Gold from a student named T

S2N spotlight
Hold tight; we are going to be students and learn something cool today. Before we go there, I stated in Friday’s letter #360:
Of course I am gloating. However, the message I want to convey is quite the contrary. I want to suggest how abnormal it is in a normal world and how normal it is in an abnormal world. It all depends on the way you model the world.
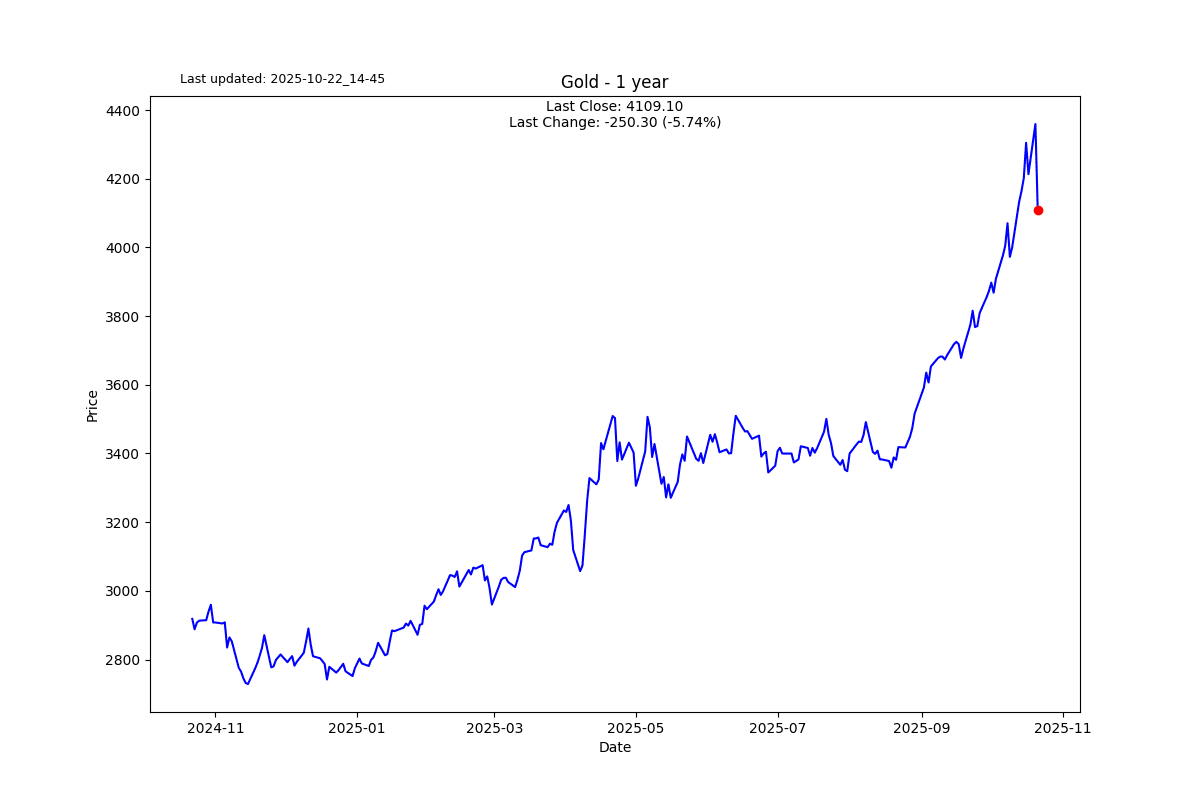
First, a few statistics about gold over the last 47 years.
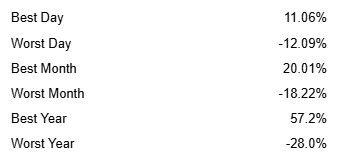
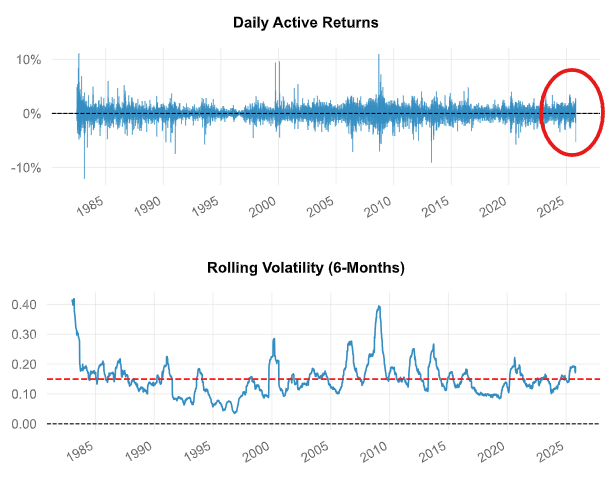
When we look at the daily returns of gold lately, we do see some bigger-than-usual moves, but nothing completely out of the norm of gold's 50-year history. The same can be said for a 6-month volatility rolling lookback window. It is only slightly above its mean.
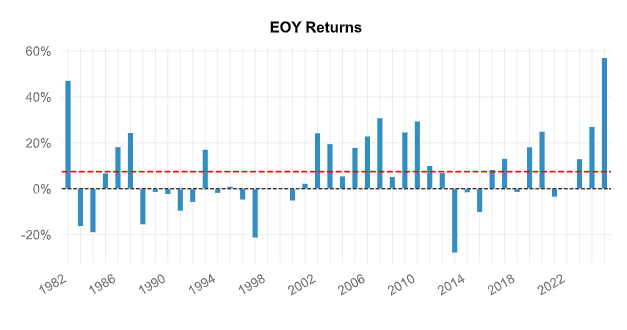
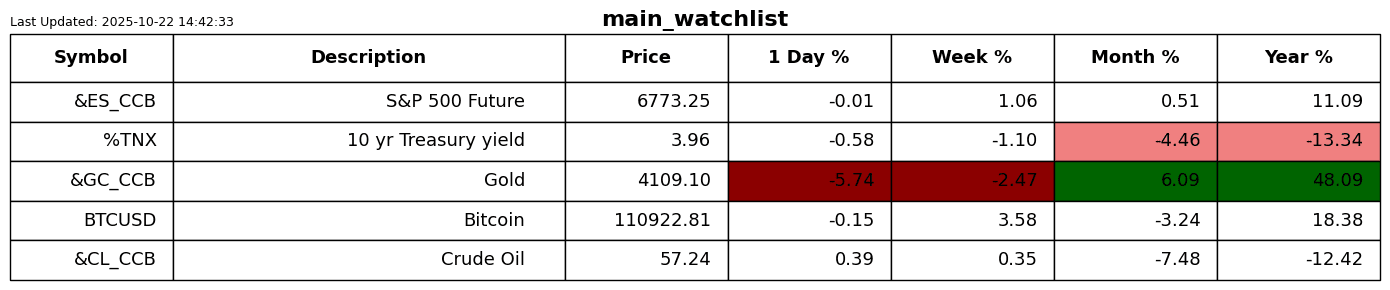
What is clear is that we are seeing gold's best yearly return.
Now for the cool stuff. I have been speaking a lot this week about probabilities and the seemingly ridiculous probabilities normal distributions forecast. One of the presenters at the conference I attended on Sunday was belabouring the point of how normally distributed models that form the edifice of finance orthodoxy are not fit for purpose.
This forces me to go back in time to a whitepaper I co-authored with Dr Vladimir Krouglov, my business partner and co-founder of the RAPA Score. We had come up with a novel approach to scoring traders' skills. However, the models we were working with used the traditional normally distributed return time series, save for a few adjustments to skew and kurtosis. Vlad, a leading European mathematician and one of only a few academics familiar with the inner workings of the math of Levy processes, suggested we adopt alpha stable distributions as part of our “secret sauce”.
I must confess to having very limited knowledge of how the formal formula works. My knowledge is more intuitive, as I have worked with alpha-stable distributions over time.
We have had a few BIG days in gold over the last 5 trading days; instead of working with the hopelessly inadequate normal distribution probability calculations, I thought it would be useful to use a much more accurate model to calculate the truer probability with the more realistic fat tails more present.
I built an alpha-stable density plot model that produced an incredibly accurate probability. There was a problem, however. It took just over an hour to run the model. I am quite pedantic with my charts and like to present them the way I see them in my mind. After two runs, I had enough of the waiting. It was killing me. By the way, well done, Vlad; you managed to engineer alpha-stable distributions across our entire database, which in 2012 was no small feat.
Will Student-t please introduce yourself?
Student-t distribution is a faster, friendlier cousin of the alpha-stable and an absolute workhorse for anyone dealing with financial data. It looks almost identical to the normal bell curve in the centre, but its tails are thicker, meaning it expects large moves to happen far more often than Gaussian theory allows.
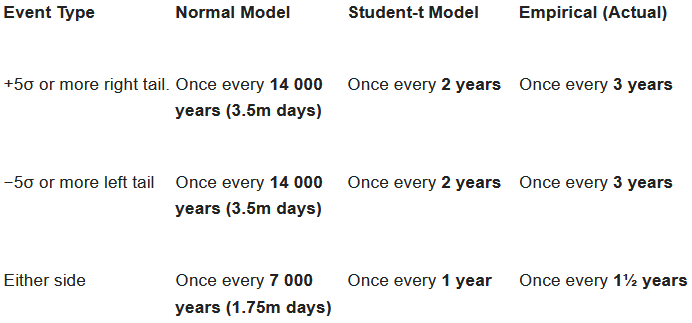
Mathematically, it’s just a slight tweak to the normal formula, but that tweak changes everything. The Student-t density is governed by a parameter called ν (nu), or “degrees of freedom”. When ν is large, say, 30 or more—the curve becomes nearly indistinguishable from the normal distribution. But when ν drops towards 3 or 4, the tails fatten dramatically. Instead of assuming that 5-sigma days happen once every seven millennia, the Student-t says they happen roughly once a year—which, inconveniently for purists, is exactly what the data shows.
In gold’s case, when I fit the model to 47 years of daily returns, the numbers came out beautifully intuitive. I should add this model takes around 30 seconds versus an hour.
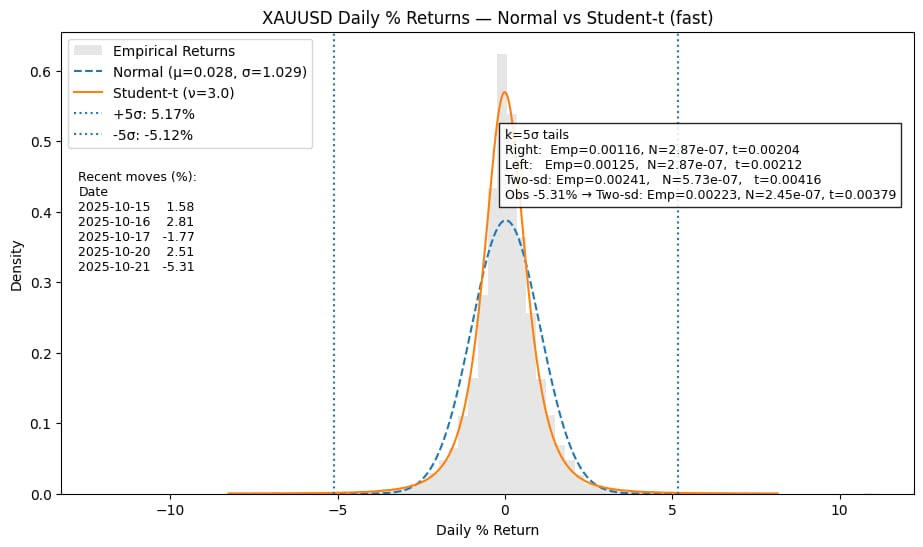
The takeaway I want you to walk away with is that the Student-t model is close enough to the actual history of returns that we can rely on it much more than any normally distributed forecast. If our research were dependent on much more accurate probabilities, I would use the alpha-stable model I built, but I don’t think it is necessary.
Don’t panic; gold is part of a much bigger narrative that has a long way still to run. The pace of gold's ascent has been a bit too steep, and nature has its own way of bringing order back to the system. Gold is not and should not be considered a speculative growth asset. It is a hedge against inflation and currency debasement.
S2N observations
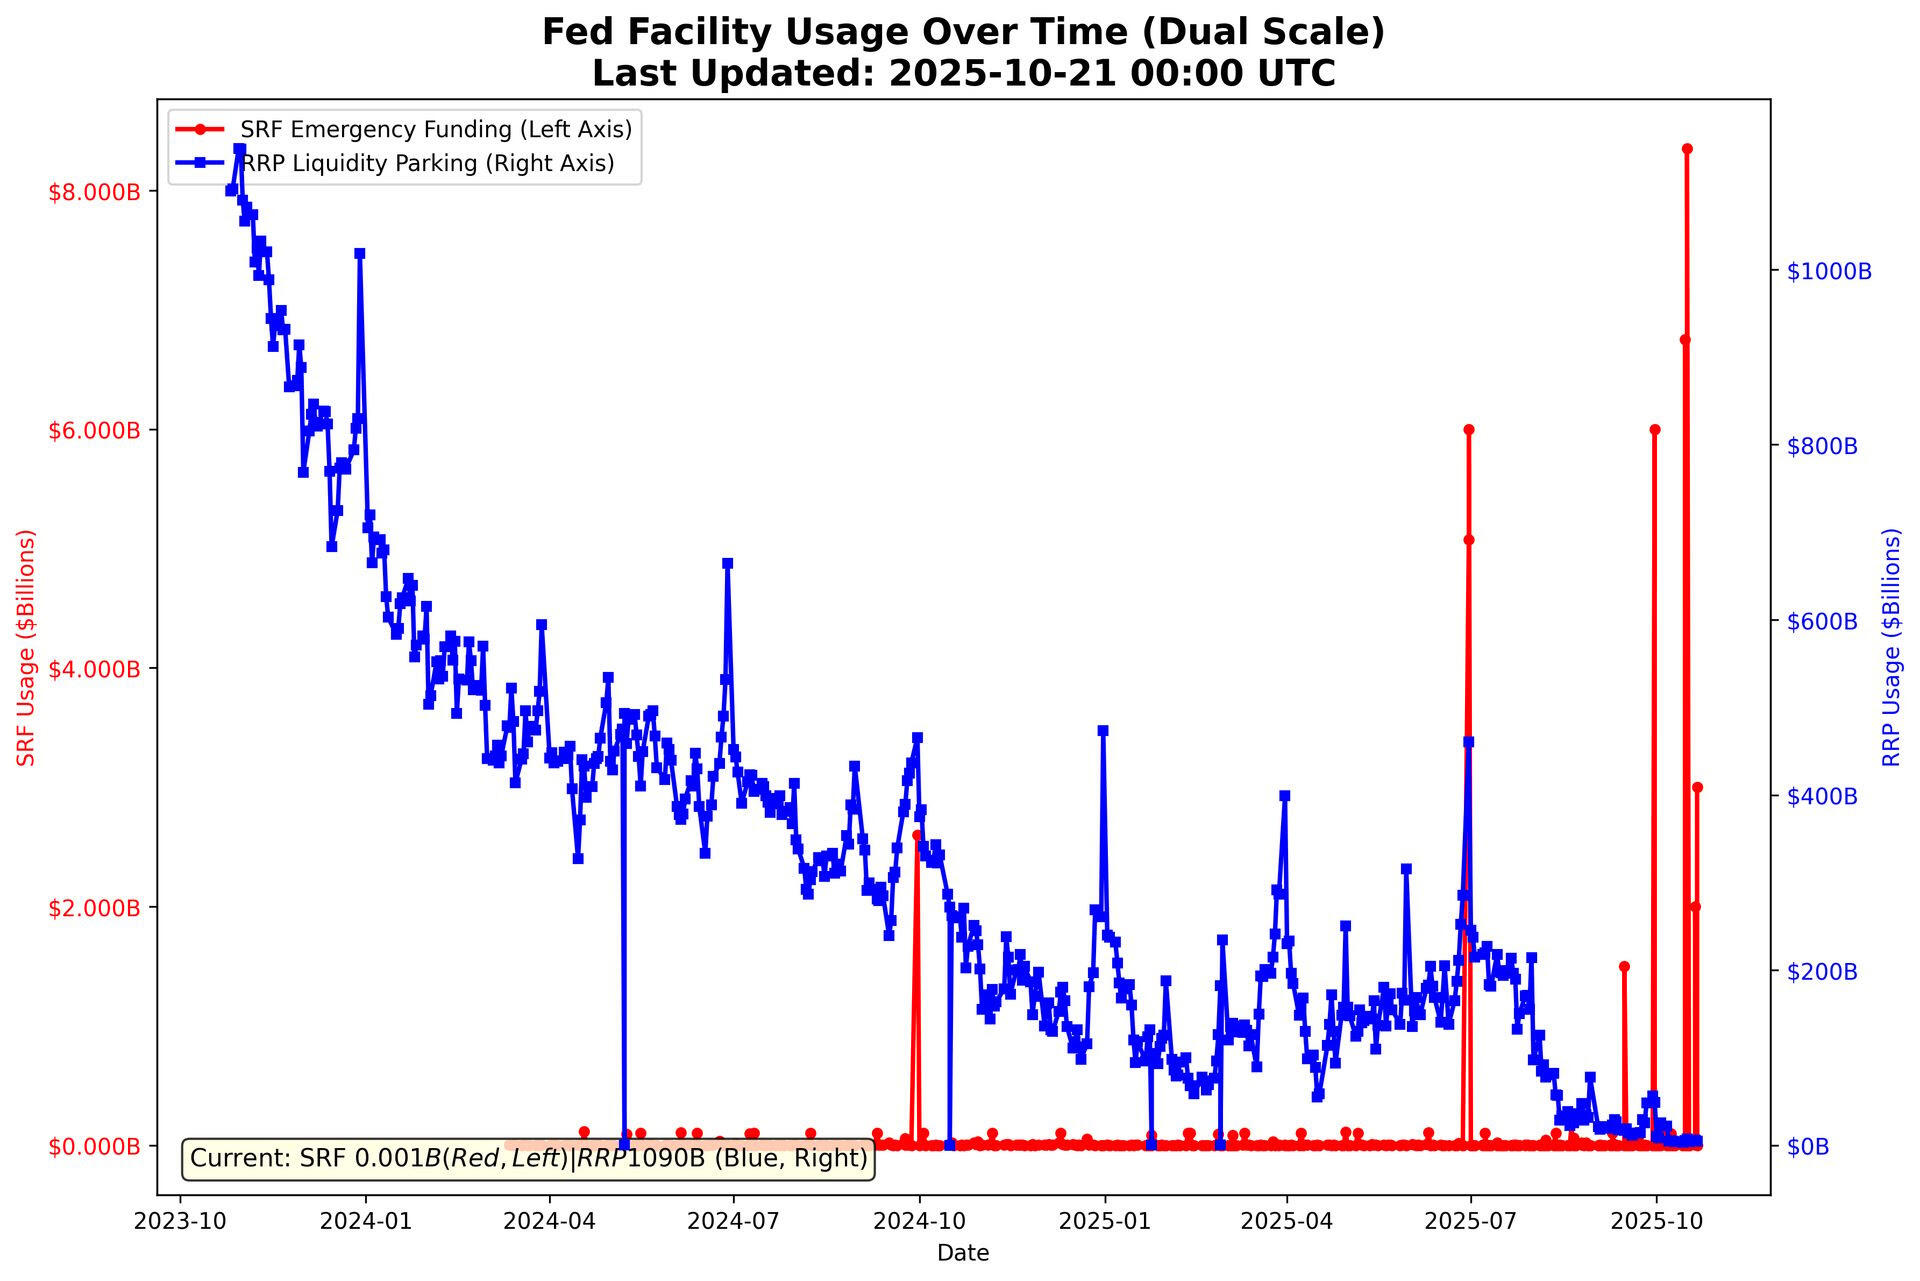
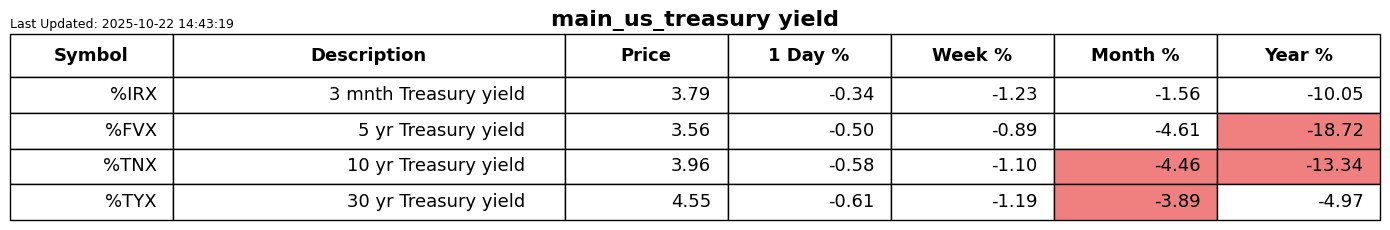
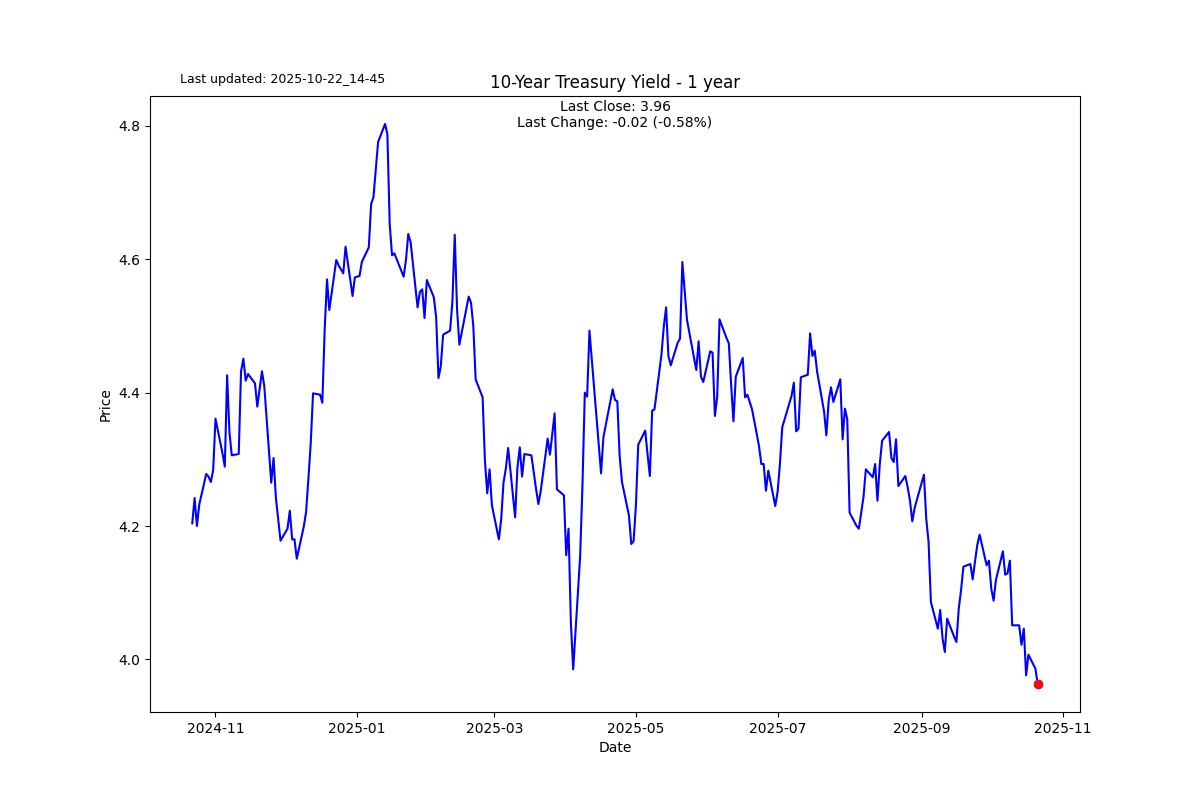
Yesterday saw another $4 billion borrowed from the Repo market. There are clear liquidity issues in the system. It is too early to say if the shots of adrenaline are working. In the spirit of the fat-tailed time series I described earlier, these “tremors” are your only real warnings to black swan events. Most are false positives. I like to know about every warning.
A reader sent me this excellent article yesterday after my AI bubble rant. I think Professor Galloway nailed it.
S2N screener alert
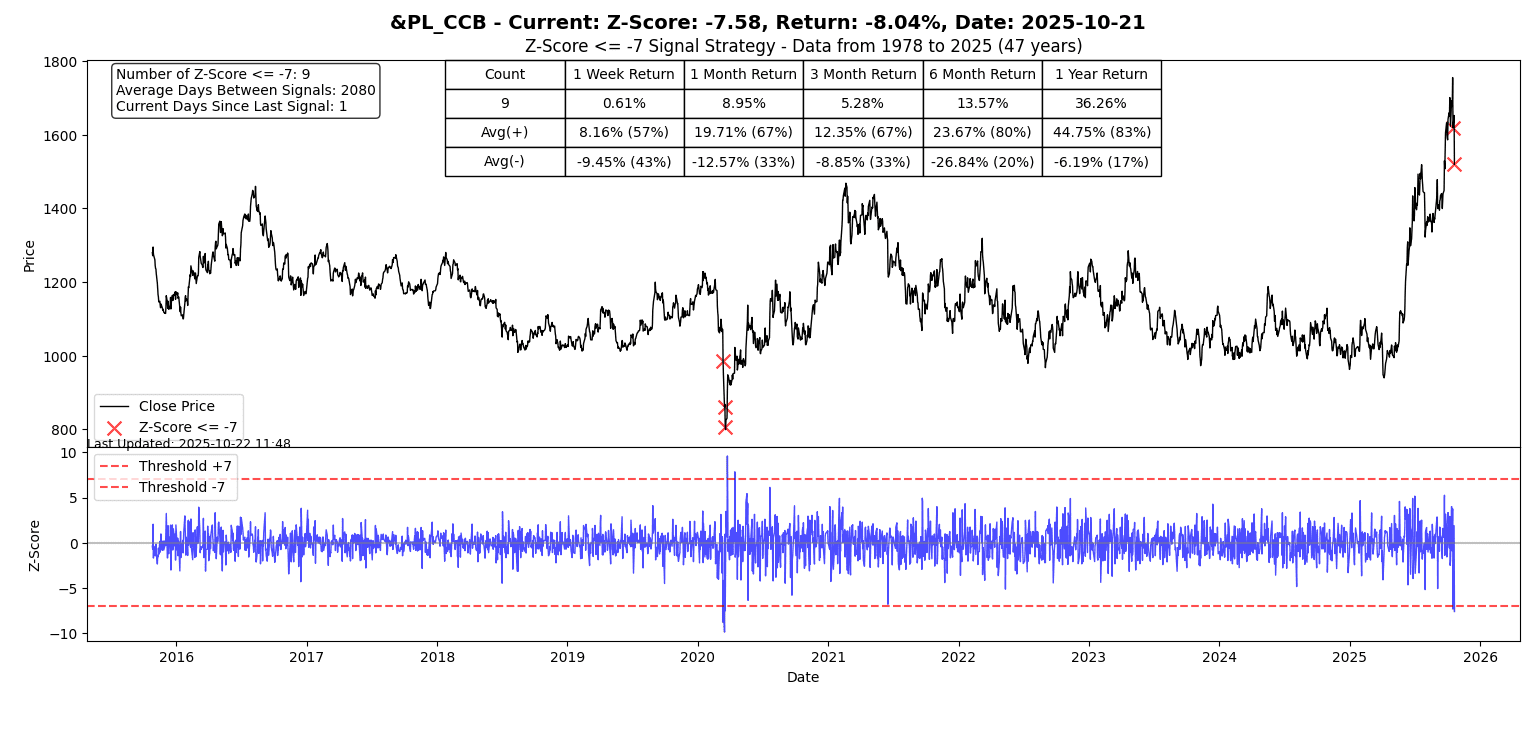
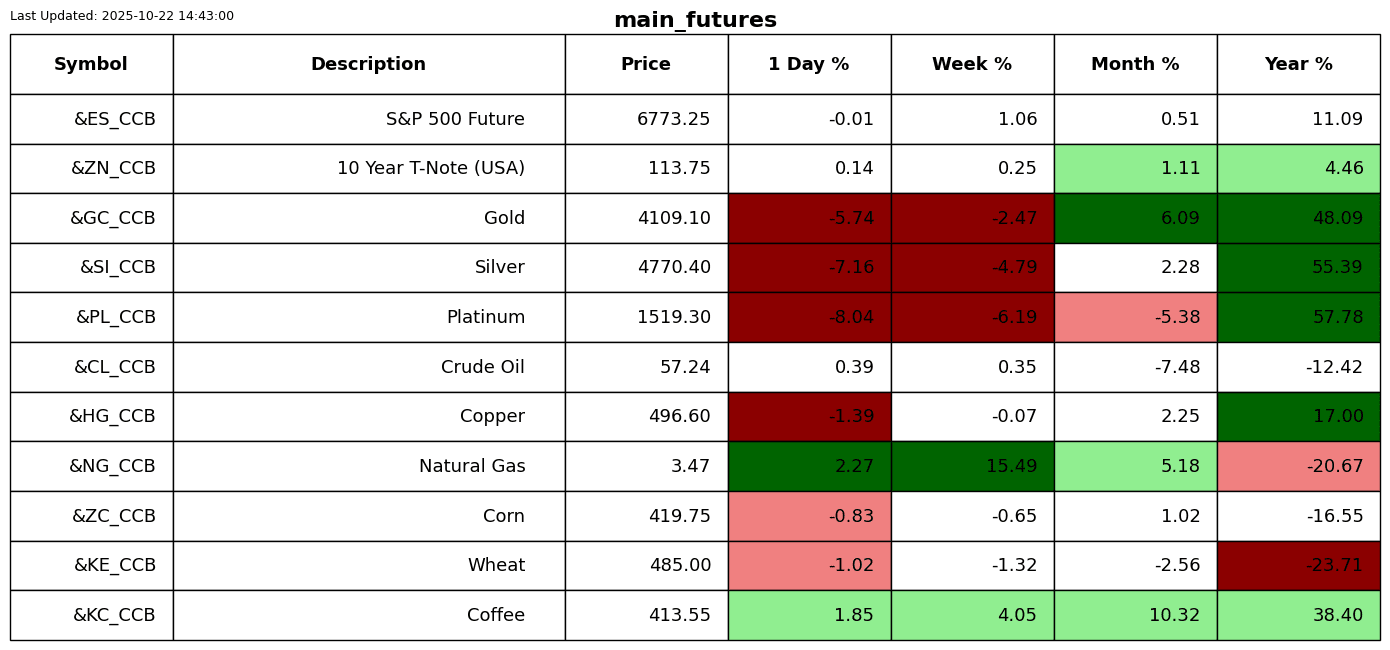
Platinum had a 7-sigma down day, its ninth in 47 years. For fun I ran the student-t model. This should happen every 780 billion days with normal distribution models. Once every 1,600 days using our model, i.e., every 6 years.
S2N performance review
S2N chart gallery
S2N news today
Author

Michael Berman, PhD
Signal2Noise (S2N) News
Michael has decades of experience as a professional trader, hedge fund manager and incubator of emerging traders.


