Good Morning Traders,

As of this writing 4:25 AM EST, here’s what we see:

US Dollar: Sept. USD is Down at 95.590.
Energies: Aug Crude is Down at 45.90.
Financials: The Sept 30 year bond is Down 1 tick and trading at 152.27.
Indices: The Sept S&P 500 emini ES contract is 6 ticks Lower and trading at 2457.00.
Gold: The Aug gold contract is trading Up at 1235.70. Gold is 20 ticks Higher than its close.

Initial Conclusion

This is not a correlated market. The dollar is Down- and Crude is Down- which is not normal and the 30 year Bond is trading Lower. The Financials should always correlate with the US dollar such that if the dollar is lower then bonds should follow and vice-versa. The indices are Down- and Crude is trading Down- which is not correlated. Gold is trading Up+ which is correlated with the US dollar trading Down-. I tend to believe that Gold has an inverse relationship with the US Dollar as when the US Dollar is down, Gold tends to rise in value and vice-versa. Think of it as a seesaw, when one is up the other should be down. I point this out to you to make you aware that when we don’t have a correlated market, it means something is wrong. As traders you need to be aware of this and proceed with your eyes wide open.

At this hour Asia is trading mixed with half the exchanges Higher and the other half Lower. As of this broadcast all of Europe is trading Lower.

Possible Challenges To Traders Today

– Import Prices m/m is out at 8:30 AM EST. This is major.

– NAHB Housing Market Index is out at 10 AM. This is major.

– TIC Long-Term Purchases is out at 4 PM EST.

Treasuries

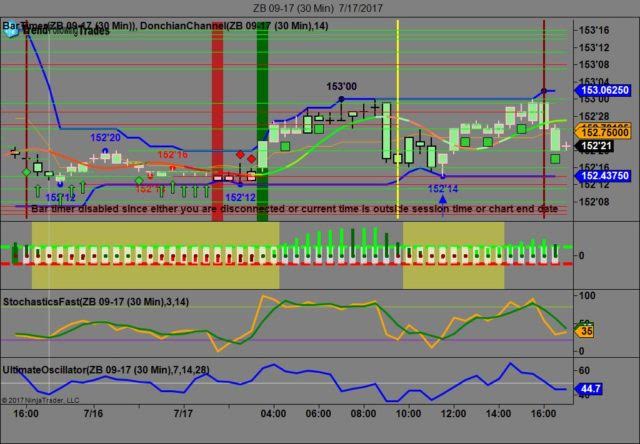
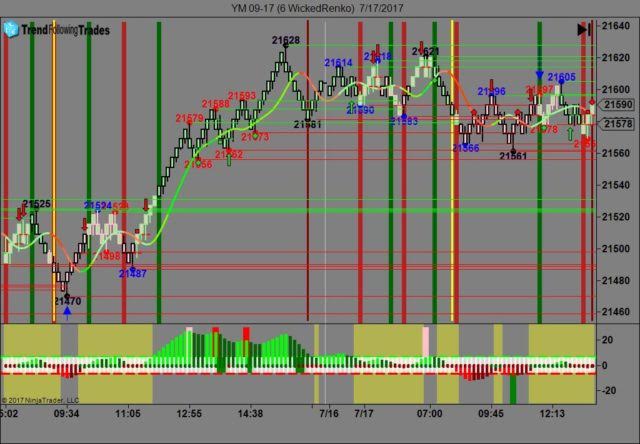
We’ve elected to switch gears a bit and show correlation between the 30 year bond (ZB) and The YM futures contract. The YM contract is the DJIA and the purpose is to show reverse correlation between the two instruments. Remember it’s liken to a seesaw, when up goes up the other should go down and vice versa.

Yesterday the ZB made it’s move at around 11:30 AM EST with no economic news in sight. The ZB hit a low at around that time and the YM hit a high. If you look at the charts below ZB gave a signal at around 11:30 AM and the YM was moving lower at the same time. Look at the charts below and you’ll see a pattern for both assets. ZB hit a low at around 11:30 AM and the YM hit a high. These charts represent the newest version of Trend Following Trades and I’ve changed the timeframe to a 30 minute chart to display better. This represented a long opportunity on the 30 year bond, as a trader you could have netted about 30 ticks per contract on this trade. Each tick is worth $31.25. We added a Donchian Channel to the charts to show the signals more clearly. Please note that the front month for the ZB contract is now September, 2017.

Charts Courtesy of Trend Following Trades built on a NinjaTrader platform.

Tea

Tea

Bias

Yesterday we gave the markets a neutral bias as the markets had no sense of direction Monday morning. The Dow closed lower by 8 points, The S&P dropped less than 1 point but the Nasdaq gained 2 points. All in all a neutral day. Today we aren’t dealing with a correlated market however our bias is to he Upside.

Could this change? Of Course. Remember anything can happen in a volatile market.

Commentary

Yesterday morning when we viewed the markets we knew automatically that it would be a neutral Day. Why? Because whenever you have a situation where either all “boats” are pointed higher or lower, there is no direction and therefore no market correlation. A neutral bias means that the markets could go in any direction and often does. We alluded to this on our market bias video which is only available to subscribers. Empire State Manufacturing came in far less than expected (9.8 versus15.2) which of course didn’t help. Today we have NAHB Housing Market Index out at 10 AM EST which is major and a proven market mover.

Trading performance displayed herein is hypothetical. The following Commodity Futures Trading Commission (CFTC) disclaimer should be noted.

Hypothetical performance results have many inherent limitations, some of which are described below. No representation is being made that any account will or is likely to achieve profits or losses similar to those shown.

In fact, there are frequently sharp differences between hypothetical performance results and the actual results subsequently achieved by any particular trading program. One of the limitations of hypothetical performance trading results is that they are generally prepared with the benefit of hindsight.

In addition, hypothetical trading does not involve financial risk, and no hypothetical trading record can completely account for the impact of financial risk in actual trading. For example, the ability to withstand losses or to adhere to a particular trading program in spite of trading losses are material points which can also adversely affect actual trading results.

There are numerous other factors related to the markets in general or to the implementation of any specific trading program which cannot be fully accounted for in the preparation of hypothetical performance results and all of which can adversely affect actual trading results.

Trading in the commodities markets involves substantial risk and YOU CAN LOSE A LOT OF MONEY, and thus is not appropriate for everyone. You should carefully consider your financial condition before trading in these markets, and only risk capital should be used.

In addition, these markets are often liquid, making it difficult to execute orders at desired prices. Also, during periods of extreme volatility, trading in these markets may be halted due to so-called “circuit breakers” put in place by the CME to alleviate such volatility. In the event of a trading halt, it may be difficult or impossible to exit a losing position.

Recommended Content


Recommended Content

Editors’ Picks

AUD/USD keeps the red below 0.6400 as Middle East war fears mount

AUD/USD keeps the red below 0.6400 as Middle East war fears mount

AUD/USD is keeping heavy losses below 0.6400, as risk-aversion persists following the news that Israel retaliated with missile strikes on a site in Iran. Fears of the Israel-Iran strife translating into a wider regional conflict are weighing on the higher-yielding Aussie Dollar. 

AUD/USD News

USD/JPY recovers above 154.00 despite Israel-Iran escalation

USD/JPY recovers above 154.00 despite Israel-Iran escalation

USD/JPY is recovering ground above 154.00 after falling hard on confirmation of reports of an Israeli missile strike on Iran, implying that an open conflict is underway and could only spread into a wider Middle East war. Safe-haven Japanese Yen jumped, helped by BoJ Governor Ueda's comments. 

USD/JPY News

Gold price pares gains below $2,400, geopolitical risks lend support

Gold price pares gains below $2,400, geopolitical risks lend support

Gold price is paring gains to trade back below  $2,400 early Friday, Iran's downplaying of Israel's attack has paused the Gold price rally but the upside remains supported amid mounting fears over a potential wider Middle East regional conflict. 

Gold News

WTI surges to $85.00 amid Israel-Iran tensions

WTI surges to $85.00 amid Israel-Iran tensions

Western Texas Intermediate, the US crude oil benchmark, is trading around $85.00 on Friday. The black gold gains traction on the day amid the escalating tension between Israel and Iran after a US official confirmed that Israeli missiles had hit a site in Iran.

Oil News

Dogwifhat price pumps 5% ahead of possible Coinbase effect

Dogwifhat price pumps 5% ahead of possible Coinbase effect

Dogwifhat price recorded an uptick on Thursday, going as far as to outperform its peers in the meme coins space. Second only to Bonk Inu, WIF token’s show of strength was not just influenced by Bitcoin price reclaiming above $63,000.

Read more

Majors

Cryptocurrencies

Signatures