A Mixed Market Again? [Video]
![A Mixed Market Again? [Video]](https://editorial.fxstreet.com/images/Markets/Currencies/Majors/DollarIndex/coin-of-the-united-states-dollar-gm486202853-38323302_XtraLarge.jpg)
US Dollar: Sept USD is Up at 97.880.
Energies: Oct '19 Crude is Up at 58.99.
Financials: The Dec 30 year bond is Up 48 ticks and trading at 159.04.
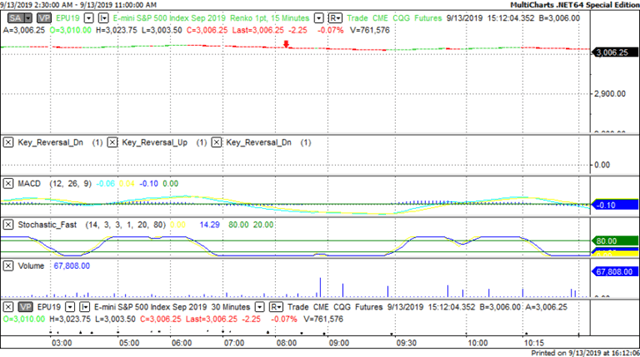
Indices: The Sept S&P 500 emini ES contract is 64 ticks Lower and trading at 2990.50.
Gold: The Dec Gold contract is trading Up at 1511.60. Gold is 121 ticks Higher than its close.
Initial Conclusion
This is not a correlated market. The dollar is Up+ and Crude is Up+ which is not normal and the 30 year Bond is trading Lower. The Financials should always correlate with the US dollar such that if the dollar is lower then bonds should follow and vice-versa. The S&P is Lower and Crude is trading Higher which is correlated. Gold is trading Higher which is not correlated with the US dollar trading Up. I tend to believe that Gold has an inverse relationship with the US Dollar as when the US Dollar is down, Gold tends to rise in value and vice-versa. Think of it as a seesaw, when one is up the other should be down. I point this out to you to make you aware that when we don't have a correlated market, it means something is wrong. As traders you need to be aware of this and proceed with your eyes wide open.
All of Asia is trading Lower with the exception of the Japanese Nikkei exchange. Currently all of Europe is trading Lower.
Possible Challenges To Traders Today
-
Empire State Manufacturing Index is out at 8:30 AM EST. This is major.
-
No other major economic news.
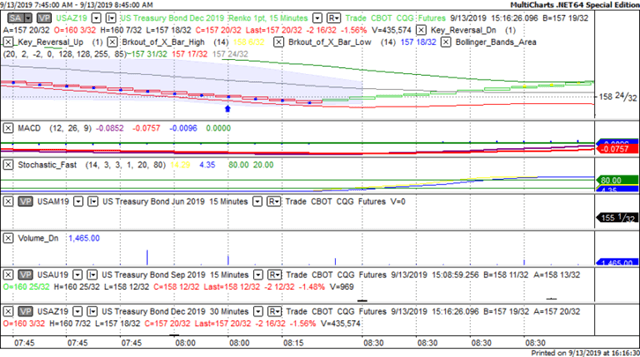
Treasuries
We've elected to switch gears a bit and show correlation between the 30 year bond (ZB) and The YM futures contract. The YM contract is the DJIA and the purpose is to show reverse correlation between the two instruments. Remember it's liken to a seesaw, when up goes up the other should go down and vice versa.
On Friday the ZB made a major move at around 8 AM EST. The ZB hit a Low at around that time and the YM hit a High. If you look at the charts below ZB gave a signal at around 8 AM EST and the YM was moving Lower at the same time. Look at the charts below and you'll see a pattern for both assets. ZB hit a Low at around 8 AM and the YM was moving Higher at the same time. These charts represent the newest version of MultiCharts and I've changed the timeframe to a 15 minute chart to display better. This represented a Long opportunity on the 30 year bond, as a trader you could have netted about 15 ticks per contract on this trade. Each tick is worth $31.25. Please note: the front month for the ZB is now December. The YM contract remains at September, 2019 (for the time being) and I've changed the format to Renko bars such that it may be more apparent and visible.
Charts Courtesy of MultiCharts built on an AMP platform
Bias
On Friday we gave the markets an Upside bias and at least for the Dow that was true. The Dow closed Higher by 37 points but the other indices faltered. The S&P dropped 2 and the Nasdaq lost 18. Today we aren't dealing with a correlated market and our bias is to the Downside.
Could this change? Of Course. Remember anything can happen in a volatile market.
Commentary
Well it would appear as though Friday the 13th didn't destroy the markets or weaken them dramatically. The Dow gained 37 points but the other indices didn't. Today we only have one report: Empire State Manufacturing Index, out at 8:30 AM EST. Whereas this is only one report, it is major and a proven market mover.
Author

Nick Mastrandrea
Market Tea Leaves


