A Good Start
US Dollar: Mar. USD is Up at 91.655.
Energies: Feb ’18 Crude is Up at 60.42.
Financials: The Mar 30 year bond is Down 1 tick and trading at 151.23.
Indices: The Mar S&P 500 emini ES contract is 20 ticks Higher and trading at 2698.00.
Gold: The Feb gold contract is trading Up at 1315.80. Gold is 4 ticks Lower than its close.
Initial Conclusion
This is not a correlated market. The dollar is Up+ and Crude is Up+ which is not normal and the 30 year Bond is trading Lower. The Financials should always correlate with the US dollar such that if the dollar is lower then bonds should follow and vice-versa. The S&P is Higher and Crude is trading Up+ which is not correlated. Gold is trading Down- which is correlated with the US dollar trading Up+. I tend to believe that Gold has an inverse relationship with the US Dollar as when the US Dollar is down, Gold tends to rise in value and vice-versa. Think of it as a seesaw, when one is up the other should be down. I point this out to you to make you aware that when we don’t have a correlated market, it means something is wrong. As traders you need to be aware of this and proceed with your eyes wide open.
At this hour Asia is trading mainly Higher with the exception of the Nikkei exchange which is Lower. As of this writing Europe is trading mainly Higher with the exception of the London exchange which is Lower at this hour.
Possible Challenges To Traders Today
-
Construction Spending m/m is out at 10 AM. This is major.
-
ISM Manufacturing PMI is out at 10 AM EST. This is major.
-
ISM Manufacturing Prices is out at 10 AM EST. This is major.
-
Total Vehicle Sales – ALL Day. This is major.
-
FOMC Meeting Minutes is out at 2 PM EST. This is major.
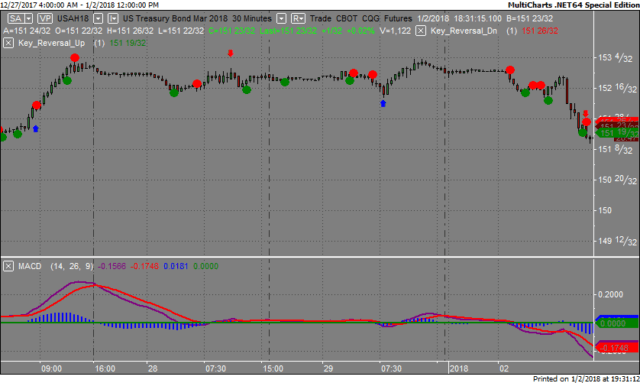
Treasuries
We’ve elected to switch gears a bit and show correlation between the 30 year bond (ZB) and The YM futures contract. The YM contract is the DJIA and the purpose is to show reverse correlation between the two instruments. Remember it’s liken to a seesaw, when up goes up the other should go down and vice versa.
Yesterday the ZB made it’s move at around 11:30 AM EST. The ZB hit a High at around that time and the YM hit a Low. If you look at the charts below ZB gave a signal at around 11:30 AM EST and the YM was moving Higher at the same time. Look at the charts below and you’ll see a pattern for both assets. ZB hit a High at around 11:30 AM and the YM hit a Low. These charts represent the newest version of MultiCharts and I’ve changed the timeframe to a 30 minute chart to display better. This represented a shorting opportunity on the 30 year bond, as a trader you could have netted about 12 plus ticks per contract on this trade. Each tick is worth $31.25. We added a Donchian Channel to the charts to show the signals more clearly.
Charts Courtesy of MultiCharts built on an AMP platform.

Bias
Yesterday we gave the markets an Upside bias as both the USD and Bonds were pointed Lower yesterday morning and this usually bodes well for an upside day. The markets didn’t disappoint as the Dow gained 105 points and the other indices gained ground as well. Today we aren’t dealing with a correlated market and our bias is to the Upside.
Could this change? Of Course. Remember anything can happen in a volatile market.
Commentary
Whereas the day before the New Years Holiday the markets dropped, the day after they regained composure. This was a great way to start the New Year off on the right footing as the markets rose in unison with the scenario being all boats rising. Besides Auto or Total Vehicle Sales out and the FOMC Meeting Minutes the two reports could in fact change market direction so it’s something to be mindful of if trading today.
Author

Nick Mastrandrea
Market Tea Leaves


