A geopolitical disaster could not take this market down

A lot of folks expected a stock market crash after Western countries imposed sanctions on Russia this weekend. They were wrong again. Equities did not crash despite having enough narratives to justify a waterfall selloff. Tensions morphed into a large-scale conflict of a nuclear superpower with NATO. The financial system has been weaponized as Western countries froze Russian reserves abroad and imposed sanctions. Subsequently, the Russian central bank hiked key rates to 20%. Nonetheless, the emergency and capital control measures could not stop the crisis. The Russian currency dropped by more than 30% and markets price a 50/50 chance of Russian default. Consequently, Russia’s economy probably entered a deep recession.
Similar financial events sent shockwaves through markets during the Russian crisis in 1998. Nonetheless, US equity indices closed Monday’s trading session slightly higher than before the invasion began. Adverse financial and geopolitical events could not take the market down. Therefore, pessimists might want to question at this junction what it takes to bring the market down after all. An essential part of the answer to that question is that fundamentals were different in 1998 than they are today.
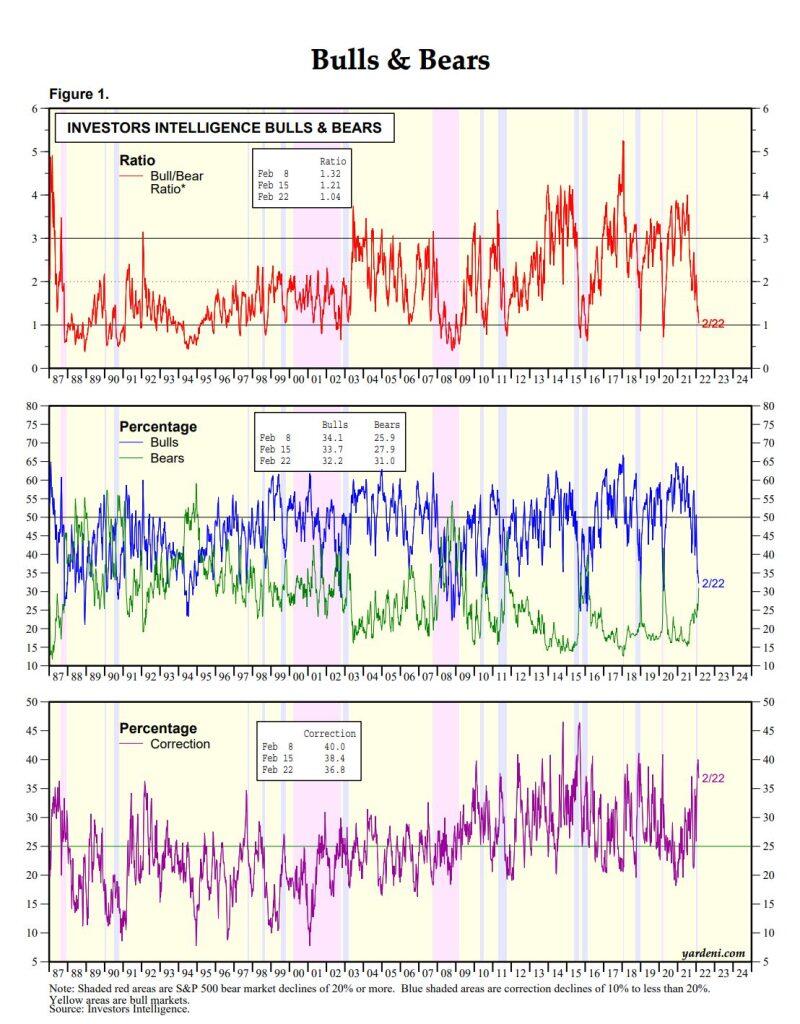
(Source: Investors Intelligence, Yardeni LLC)
Macro indicators are constructive, and sustained bear markets only unfolded in recessions. Moreover, behavioral evidence is also positive from a contrarian perspective. The Investors Intelligence Bull-Bear ratio, for example, was just slightly above one on February 22nd. It would have probably dropped below one if the poll were taken on the day of the Russian invasion in Ukraine. Another sentiment indicator, the AAII poll data, confirms that individual investors are extremely pessimistic. Similarly pessimistic prints were recorded near the beginning of sustainable rallies, according to decades of statistical evidence.
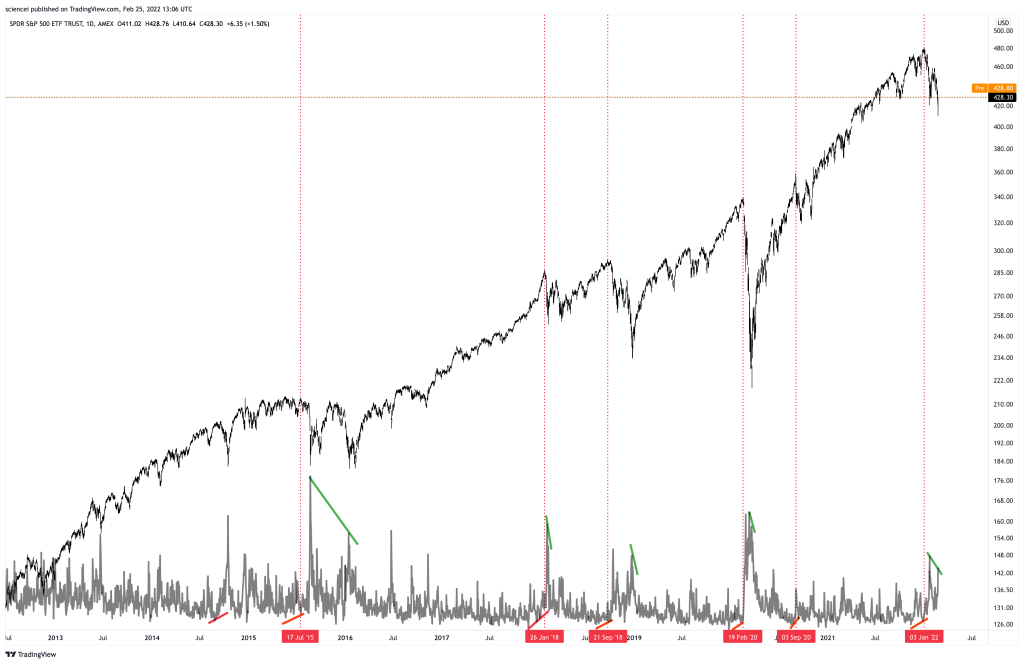
Technical signals line up on the same side of the ledger. Momentum continued diverging from one low to the next low. Volume confirms this picture as the second chart shows. The SPY ETF’s volume diverged on a lower low last week. During the past few years, the same volume divergence was also evident at durable market bottoms and tops. Sellers could be done here as the vast majority expects significantly more downside.
The most likely Elliott wave path is as well on track for an all-time high during the next few weeks. A fourth wave of intermediate degree was probably unfolding as the S&P 500 corrected during recent weeks. The correction either ended last week or has a final leg of subminuette degree left to the downside. A fading three-wave correction during the next few days signals more upside. Bulls want to see a sustained break of the 4490 S/R to confirm a trend reversal. That signals that a local bottom might be in after going through oversold and excessively pessimistic conditions. Nonetheless, there is not enough evidence that equities already reversed. Another bearish swing on weaker momentum could still target 4065 before the next sustainable rally begins.
All in all, the conclusion does not change: The bull run is likely maturing but not over yet. US equities will probably rally and take the S&P 500 towards 5000-5200 during the next few weeks. Macroeconomic, behavioral, and technical evidence remains constructive.
Interested in more of our ideas? Check out Scienceinvesting for more details!
Author

Science Investing Team
Science Investing


