A Double Bottom for the Dollar Basket?

The US dollar basket (DXY) may be traded as a futures instrument or an ETF, but it is also important index watched by the entire market as a gauge of US dollar strength or weakness. It measures the value of the USD relative to a basket of currencies with the euro being the largest weight at 57.6%. For the last couple of weeks, there has been a lot of volatility and noise in the market and so keeping an eye on the DXY is an effective way to average out US dollar price behaviour.
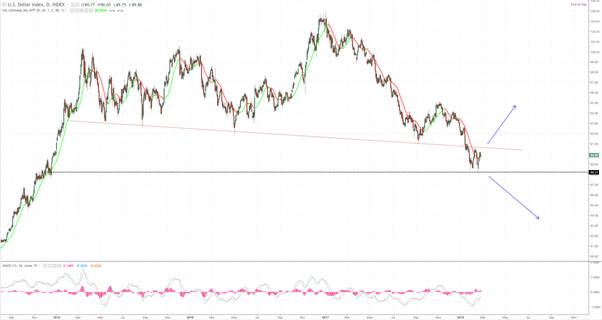
Looking at the US dollar index chart, we can see that price fell below a floor of support to an important historical level. Since then the price has been put in a double bottom, bouncing upwards from this historical level twice. Double tops or double bottoms are very popular among traders as they signify a successful test and price rejection from a recent new high (or low). A double bottom signifies a very strong level of support and buyers have confidence in trading the currency pair long because the odds of price continuing lower is reduced.
On the other hand, the price has trouble bouncing higher than the continuation of the line that was previously acted as support, but now a level of resistance. It is for this reason that the DXY will possibly consolidate a little longer, but should it bounce back above the support-turned-resistance line or move below the latest support line, (thereby negating its importance) we will finally be able to determine where the US dollar is generally headed. If the DXY appreciates, convincingly back above 91, then going long on the US dollar could be a potentially strong medium-long term trading idea.
Author

Adinah Brown
Leverate


