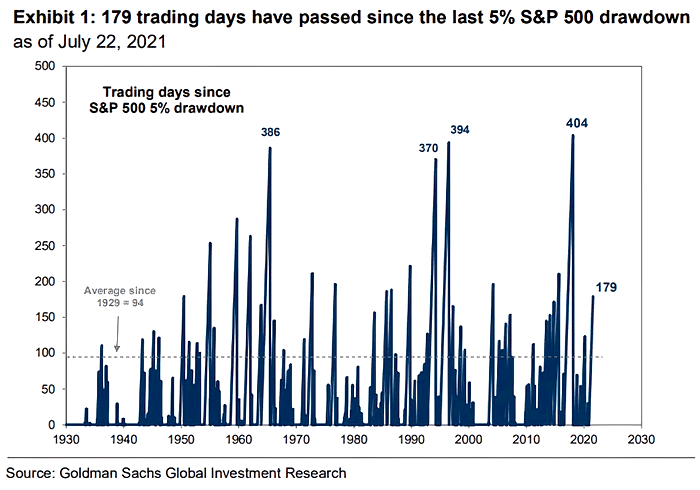
A correction is on the way

Buyers wasted no time and initiated a fulminant risk-on rally after the mid-July correction. Consequently, the S&P 500 did not even reach a 5% correction and rallied to all-time highs. A 5% correction has been typically occurring about every 94 trading days since 1929. It is overdue as more than 180 trading days have passed since the last 5% correction as the data from Goldman Sachs reveals.
Another downside leg remains most likely as US indices have not reached typical minimum retracements yet. Technicals tell the same story. The major US indices diverge strongly across all metrics. Breadth, momentum, and cross-market indicators do not confirm the all-time highs on the S&P 500. Historically, equities faded most often in situations that recorded similar technical conditions. Moreover, the S&P 500 approaches a cyclical trend resistance. It is depicted by the upper bound of the pale grey trend channel, which has guided the S&P 500 since 2009.
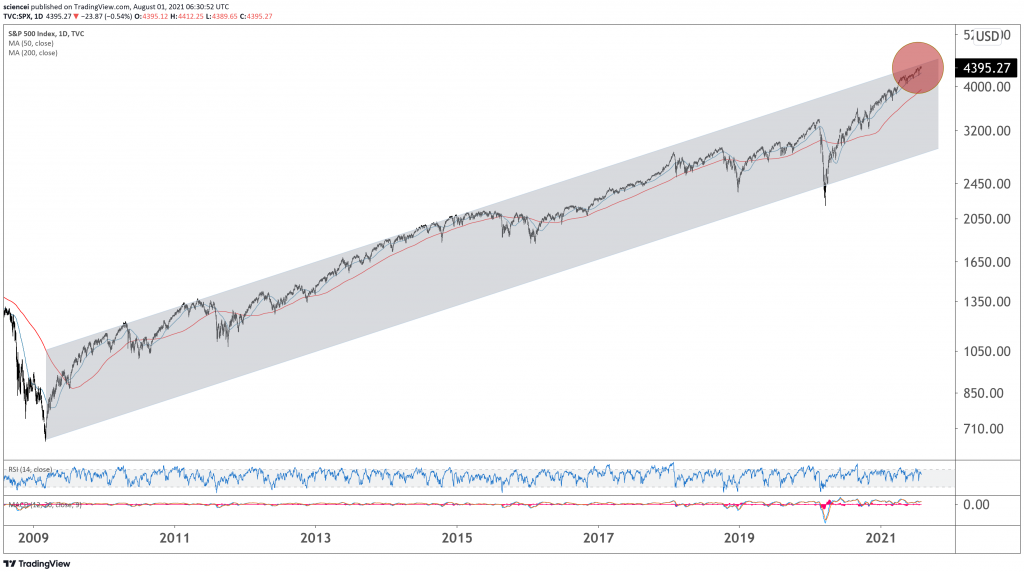
Regardless of the technical evidence, a sustained breakout above 4363 in the S&P 500 confirms that the rally continues. An immediate upside continuation without a 5%-10% correction implies that the S&P 500 breaks out above the sharp trend channel that guided the rally off the GFC 2009 low. The trend that lasted more than a decade is unsustainable per se. A breakout along with an even stronger rally at this junction is a recipe for disaster. It signals a blow-off top.
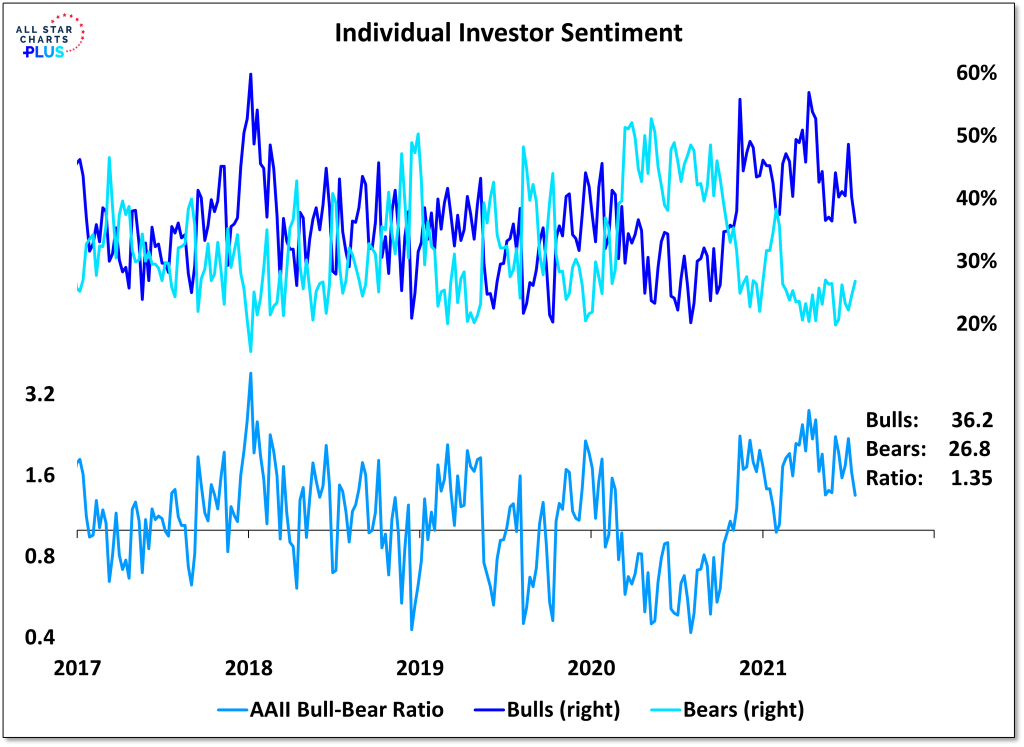
(Source: All Star Charts, J.C. Parets)
Behavioral evidence supports the technical and statistical observations discussed above. Sentiment has been stretched for an extraordinarily long time. Recently, AAII bulls dropped to their lowest level since Oct. However, with bears still relatively low, the bull to bear ratio is the lowest since Jan. It appears if optimism is unwinding after peaking around April. Historically it paid off well to join the herd until sentiment reverses from an extreme.

A final 5% leg down remains likely before equities inflate during the next few weeks. There was too much momentum in the market on longer-term indicators most recently. Buyers are likely coming in again after another 5%-10% correction that is imminent or started already. None of our macroeconomic recession indicators are flashing red at this time. But with high uncertainty, the Federal Reserve leaning towards gradual tightening, and equities priced for perfection, downside risk remains elevated. One among many examples is the 4Q trailing P/E valuation indicator. It trades at an all-time high relative to the past 120 years. One of Warren Buffet’s favorite macro indicators, market cap to GDP is another example. The indicator reached a multi-decade high as well most recently.
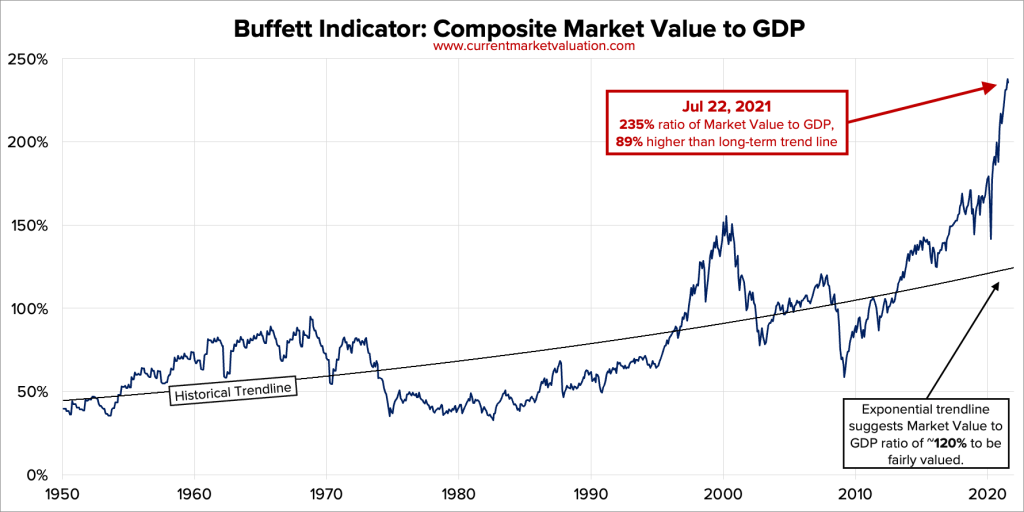
(Souce: currentmarketvaluation.com)
All in all, a roughly 5% correction likely resolves into a late-summer rally. However, it will most likely be a flash in the pan and setting the stage for another crash. That has been the norm during the past three years and is not an exception. History demonstrated that valuations matter eventually. It will be unlikely different this time.
Interested in more of our ideas? Check out Scienceinvesting for more details!
Author

Science Investing Team
Science Investing


