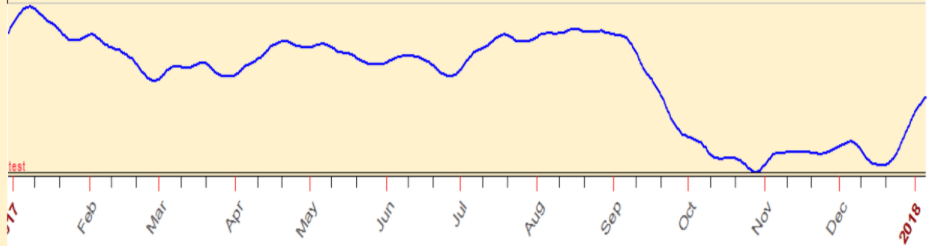
2017 Cycles View

This cycle hits a high in mid-August.
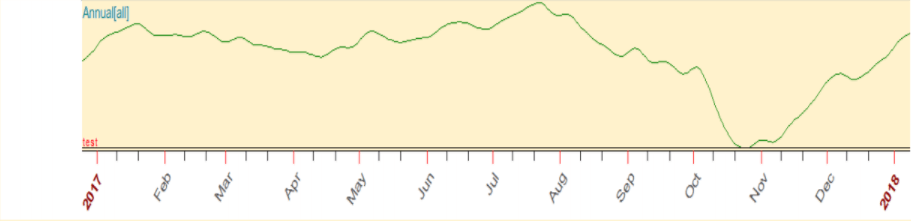
Addition of 1, 4, and 10-Year Cycles in 2017
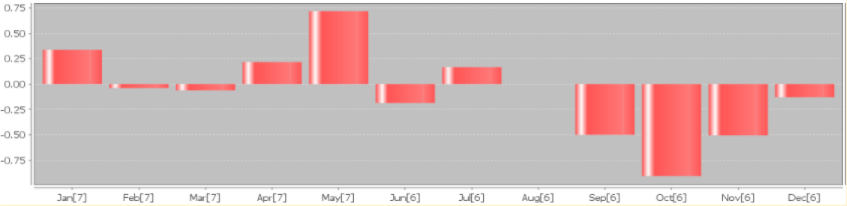
This is a year ending in a 7, and the composite below is the average performance in all years ending in 7 from 1887. The cycle peaked in mid-July.
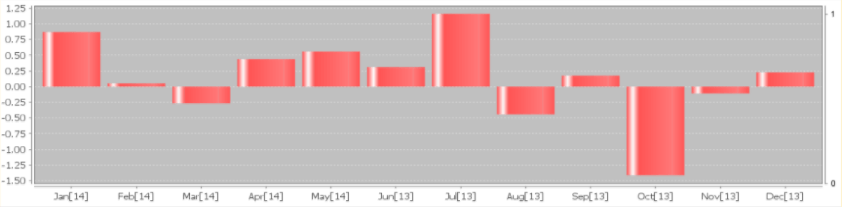
Histogram of Monthly Expected Return in 2017: All Years Ending in 7
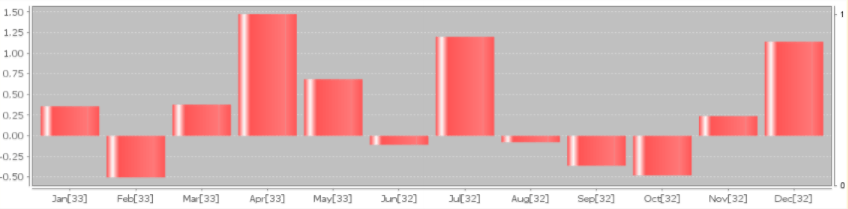
Histogram of Monthly Expected Return in 2017: All Post-Election Years
Histogram of Monthly Expected Return in 2017: All Years Ending in 7 that Have Also Been Post-Election Years
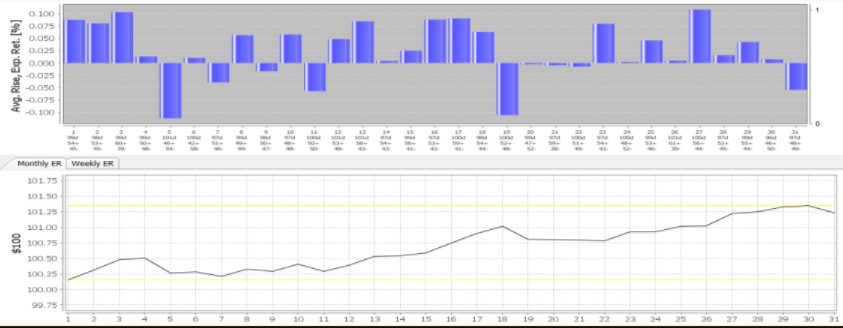
August Histograms
The histograms below show the average behavior of the DJIA from 1885 to 2016 in several different formats for the current month. The graph below shows the expected return (the probability of the market rising times the percent change).
Average Daily Expected Return of DJIA (1886-2016)
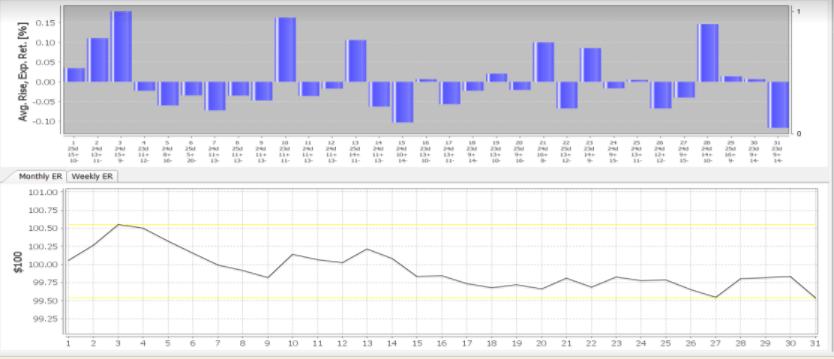
Average Daily Expected Return of DJIA in a Post-Election Election Year (1886-2016)
This is an excerpt from the monthly Cycles Research Early Warning Service, a monthly e-mail report that analyzes the trends in the US stock market, the bond market, and the gold market. There are stock and ETF recommendations and high-probability S&P turning points.
Cycles Research Early Warning Service has been ranked the top stock market timing service for 2016 by Timer Digest, an independent rating service in Ct., USA.
Author

Bill Meridian
Cycles Research


