2% wages: Why Canada’s weak jobs data strengthens the BoC’s stance
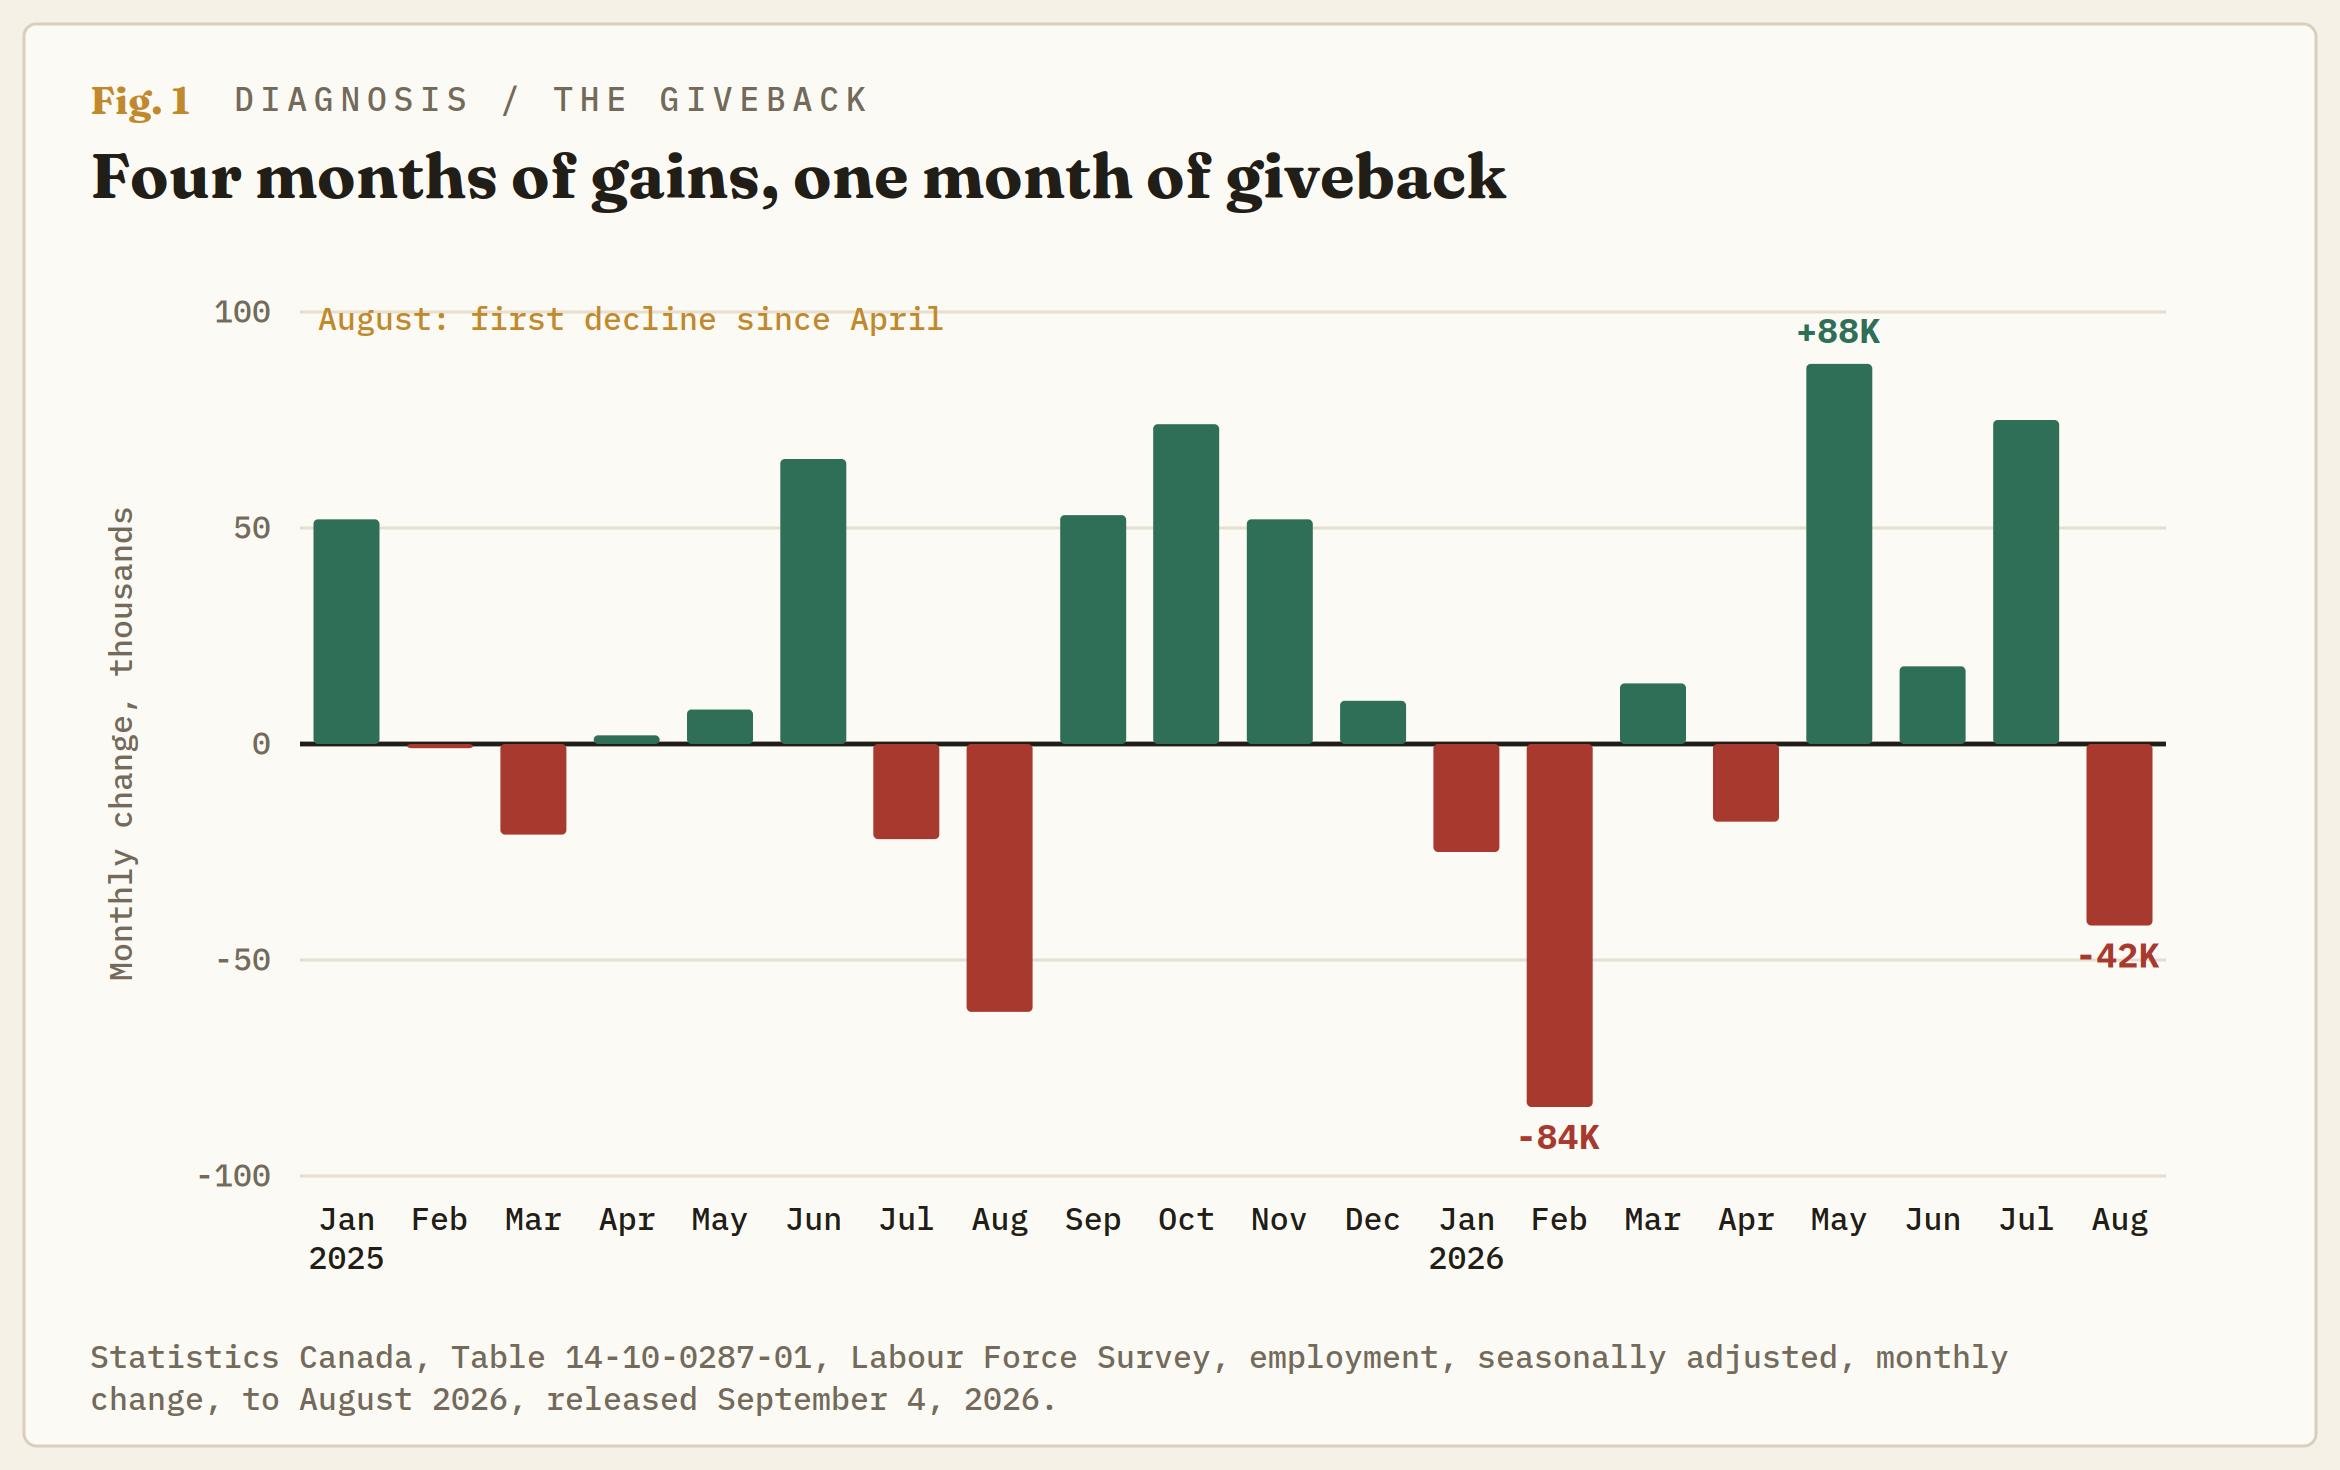
Canada lost nearly 42K jobs in August against forecasts for a 15K gain, and the unemployment rate stayed at 6.4% anyway. Wages grew 2% on the year, the slowest since November 2017 outside the pandemic years. Two days after the Bank of Canada (BoC) held at 2.25% with a rate statement that called the labour market improved, demand subdued, and excess supply continuing, the August Labour Force Survey (LFS) has confirmed the last two claims and taken a quarter of the first one back. Then the curve did the strange thing: it priced in more hikes.
In the same hour, US payrolls printed 162K against a forecast near 55K, and the two prints pulled the Loonie the same way. Every USD/CAD bounce since the July peak has topped below the last, and Friday's kept the sequence: about 80 pips on the release, three times the overnight range, retracing a fifth of the 480-pip slide from that peak and two-thirds of the midweek drop inside the first hour, and still stalled under the early-September high. Daily momentum had turned up from oversold a week before the print, so the release accelerated a bounce that was already running rather than starting a new leg. The BoC's slack story survived Friday, but what didn't survive is the idea that the hikes the market is pricing have anything to do with the labour market.
Three claims, one scorecard
Take the BoC’s three labour claims in its September 2 rate statement one at a time. Improved in recent months: employment fell 42K, the employment rate slipped to 60.8%, level with January, and the 181K added between April and July is 139K net. Youth lost 19K jobs and the core-age group 16K. Four industries fell, led by business and building support services at 20K, and manufacturing was the only significant gain at 22K, most of it in Ontario, in a survey week that predates the August 22 tariffs.
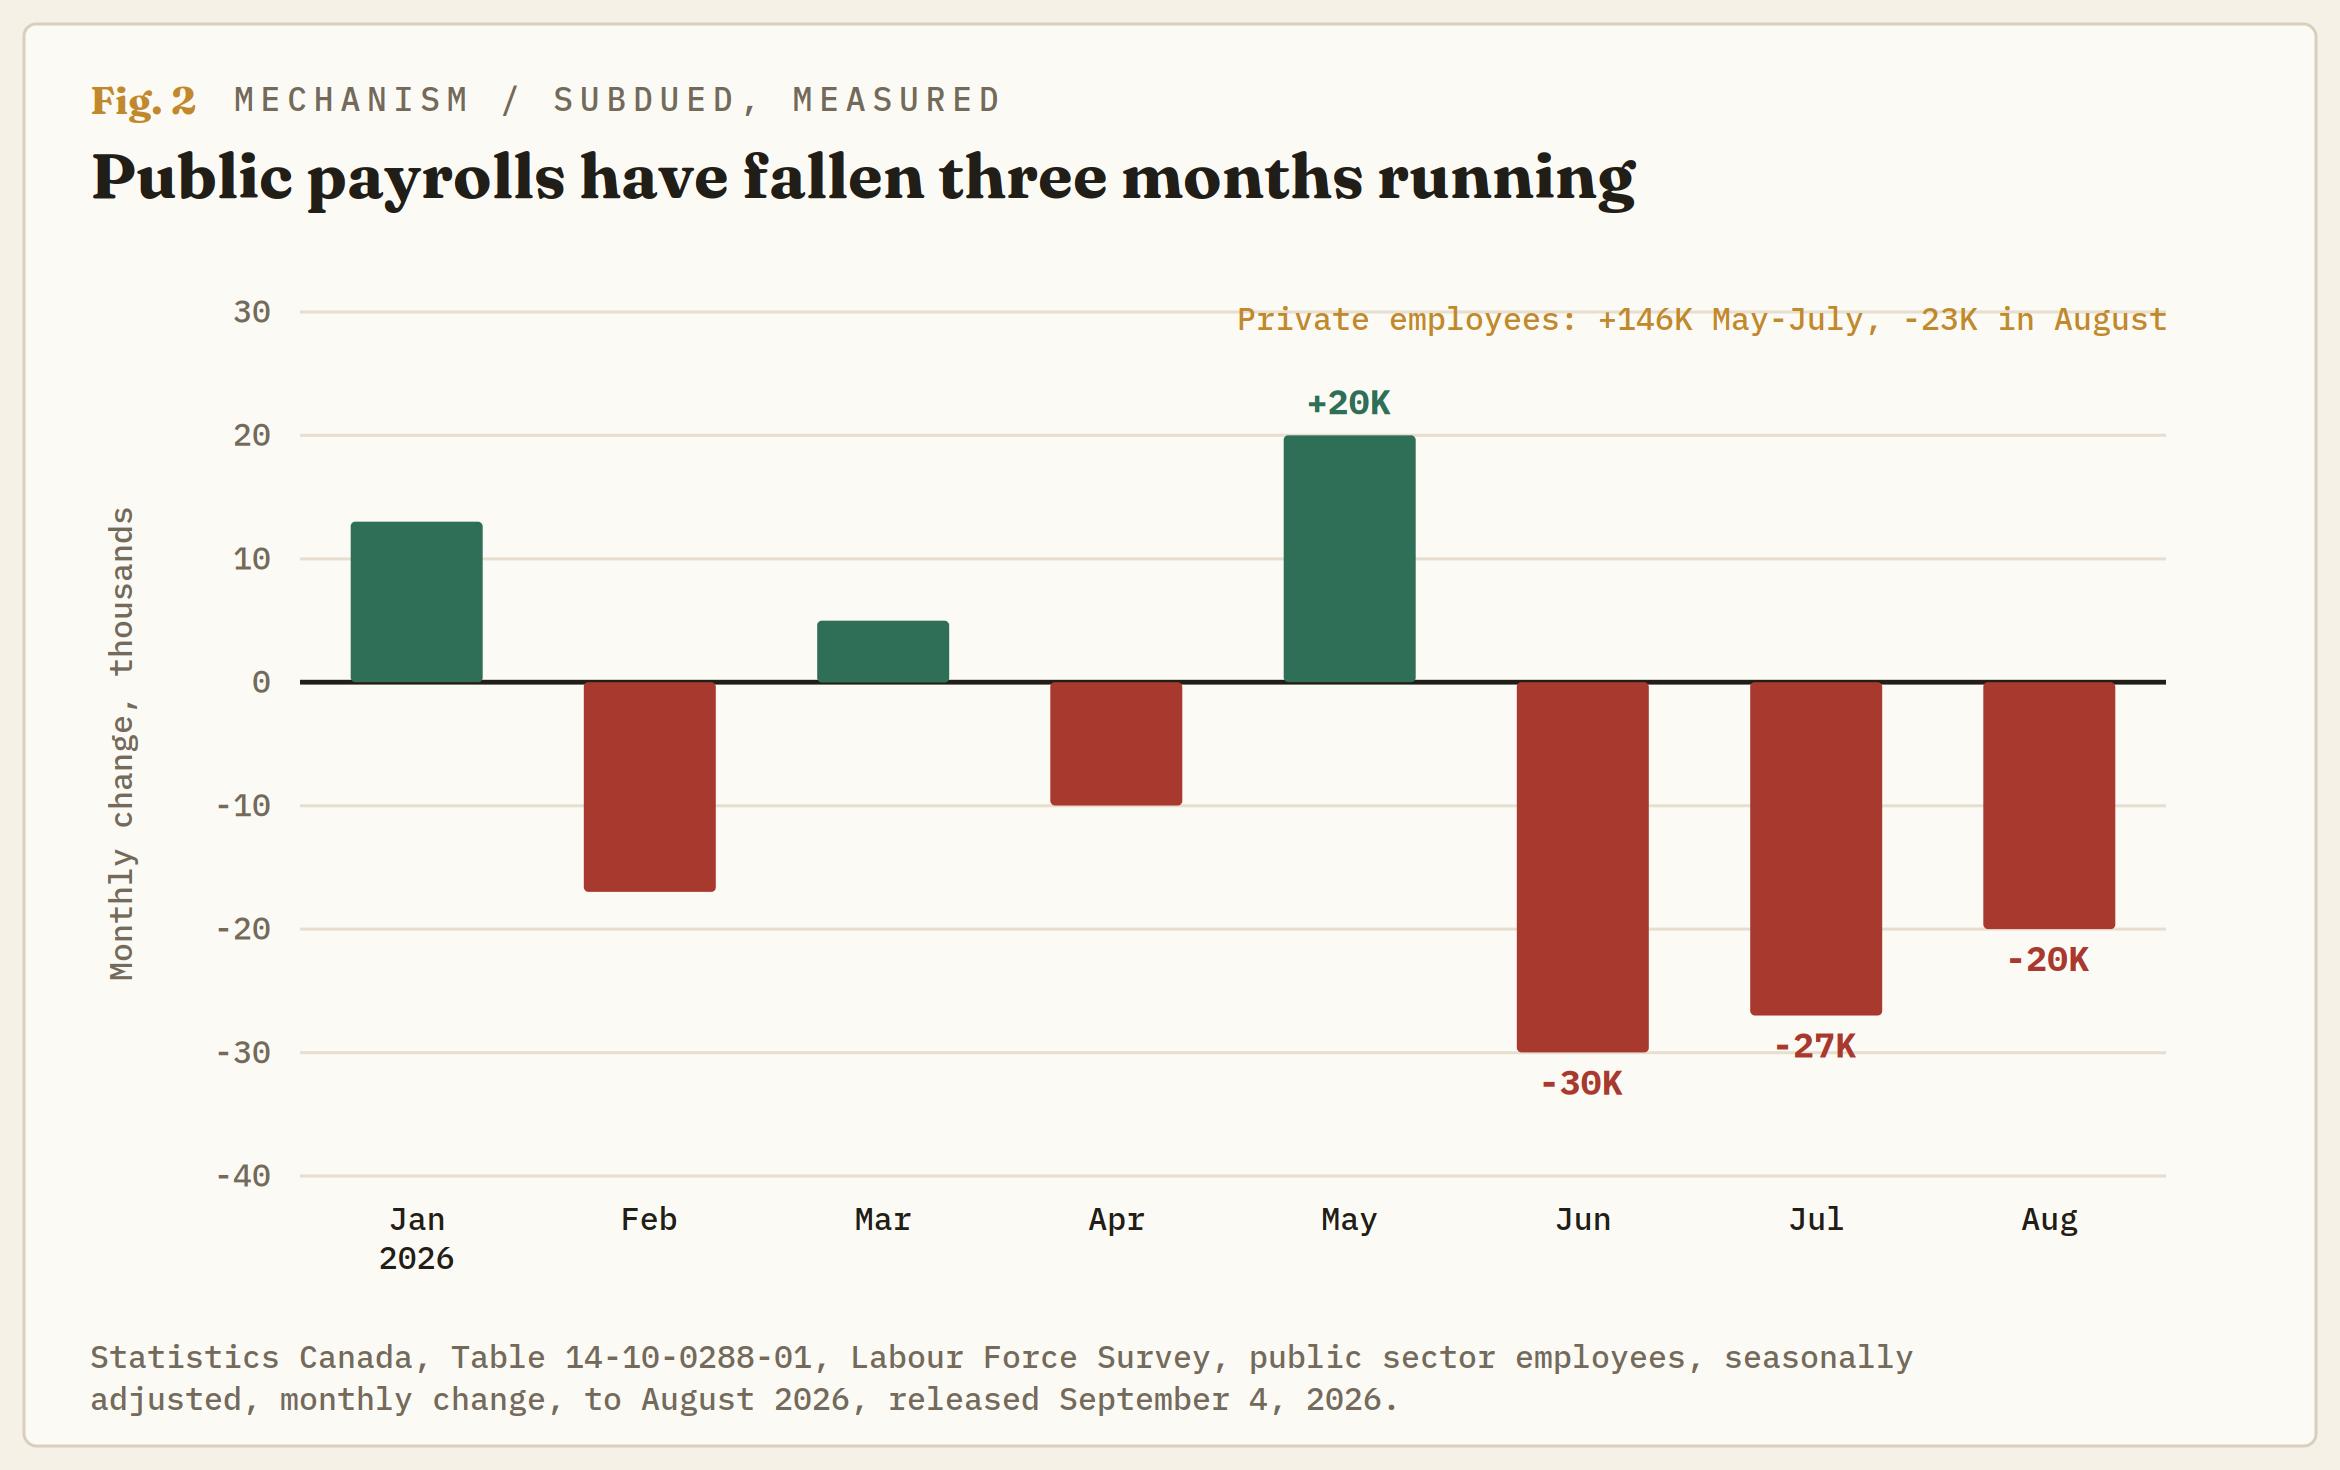
Demand for labour remains subdued: the print rewrote this one in the BoC's favour and then some. Private-sector employees were flat on the month, the self-employed were flat, and the public sector shed 20K for a third straight decline, 78K since May. Employers aren't firing, with the layoff rate at 0.8% against 1.0% a year ago, but they aren't opening positions either, and Statistics Canada now reports the layoff rate in export-dependent industries running at 0.9% over the year against 0.7% elsewhere, with the new tariffs named as the reason.
Continued excess supply: the rate stayed at 6.4% because the labour force shrank, not because anyone was hired. The number that decides it is wages.
The rate that didn't move, and why
Participation fell 0.1 percentage points to 65%, giving back July's rise. Hold it at July's level and August's rate works out near 6.6%, inside the 6.5%-7% range the July 15 rate statement gave and the labour market had supposedly left. The detail underneath is two supply moves cancelling. Core-aged women saw their unemployment rate fall to 5% as 31K of them left the labour force and their employment fell 17K. Core-aged men saw theirs rise to 6% because more of them started looking. An unchanged headline, built from movements in who is counted rather than who is hired.
The pool itself is still shrinking. Statistics Canada's population estimate fell for a third straight quarter in the three months to April, and retirements and the exit of temporary residents keep trimming the labour supply behind the 6.4%. That is why a steady or falling rate has stopped being a demand signal in Canada, and why the BoC could write improved and subdued in the same statement without contradiction. A rate that holds while employment falls 42K isn't tightness. It's a smaller denominator.
The 2%
Wage growth has decelerated for two straight months, from 3.3% in June to 2.8% in July to 2% in August, and for the bottom quarter of earners it's 1.1%. Against the headline inflation near 3% the BoC has been looking through, the average worker is losing about a point a year in real terms, and the long-term unemployed are 24% of the total against a pre-pandemic norm of 17%.
This is the sentence that matters for October 28. Governor Tiff Macklem told Wednesday's press conference that policymakers were prepared to raise more than once if inflation stayed too high. Inflation staying too high on Oil and tariff pass-through is one thing. A wage-price loop is another, and 2% wage growth in a labour market that just lost 42K jobs rules the second out. The first LFS taken with both sides' tariffs in force, the September survey, lands October 9, nineteen days before the decision. Until then, the domestic case for a hike has to be made without labour.
The curve that didn't listen
Before the print, pricing carried 43% of a hike for October 28 and an implied 2.48% after December 9. After it, 48% and 2.54%, a December hike fully priced with 16% of a second on top, 3.21% by September 2027 and a twelve-month outlook of three or four hikes. The path sits above every earlier vintage on the screen. A jobs loss, falling participation and the weakest wage growth in nearly nine years, and the Canadian curve added to its hikes rather than trimming them.
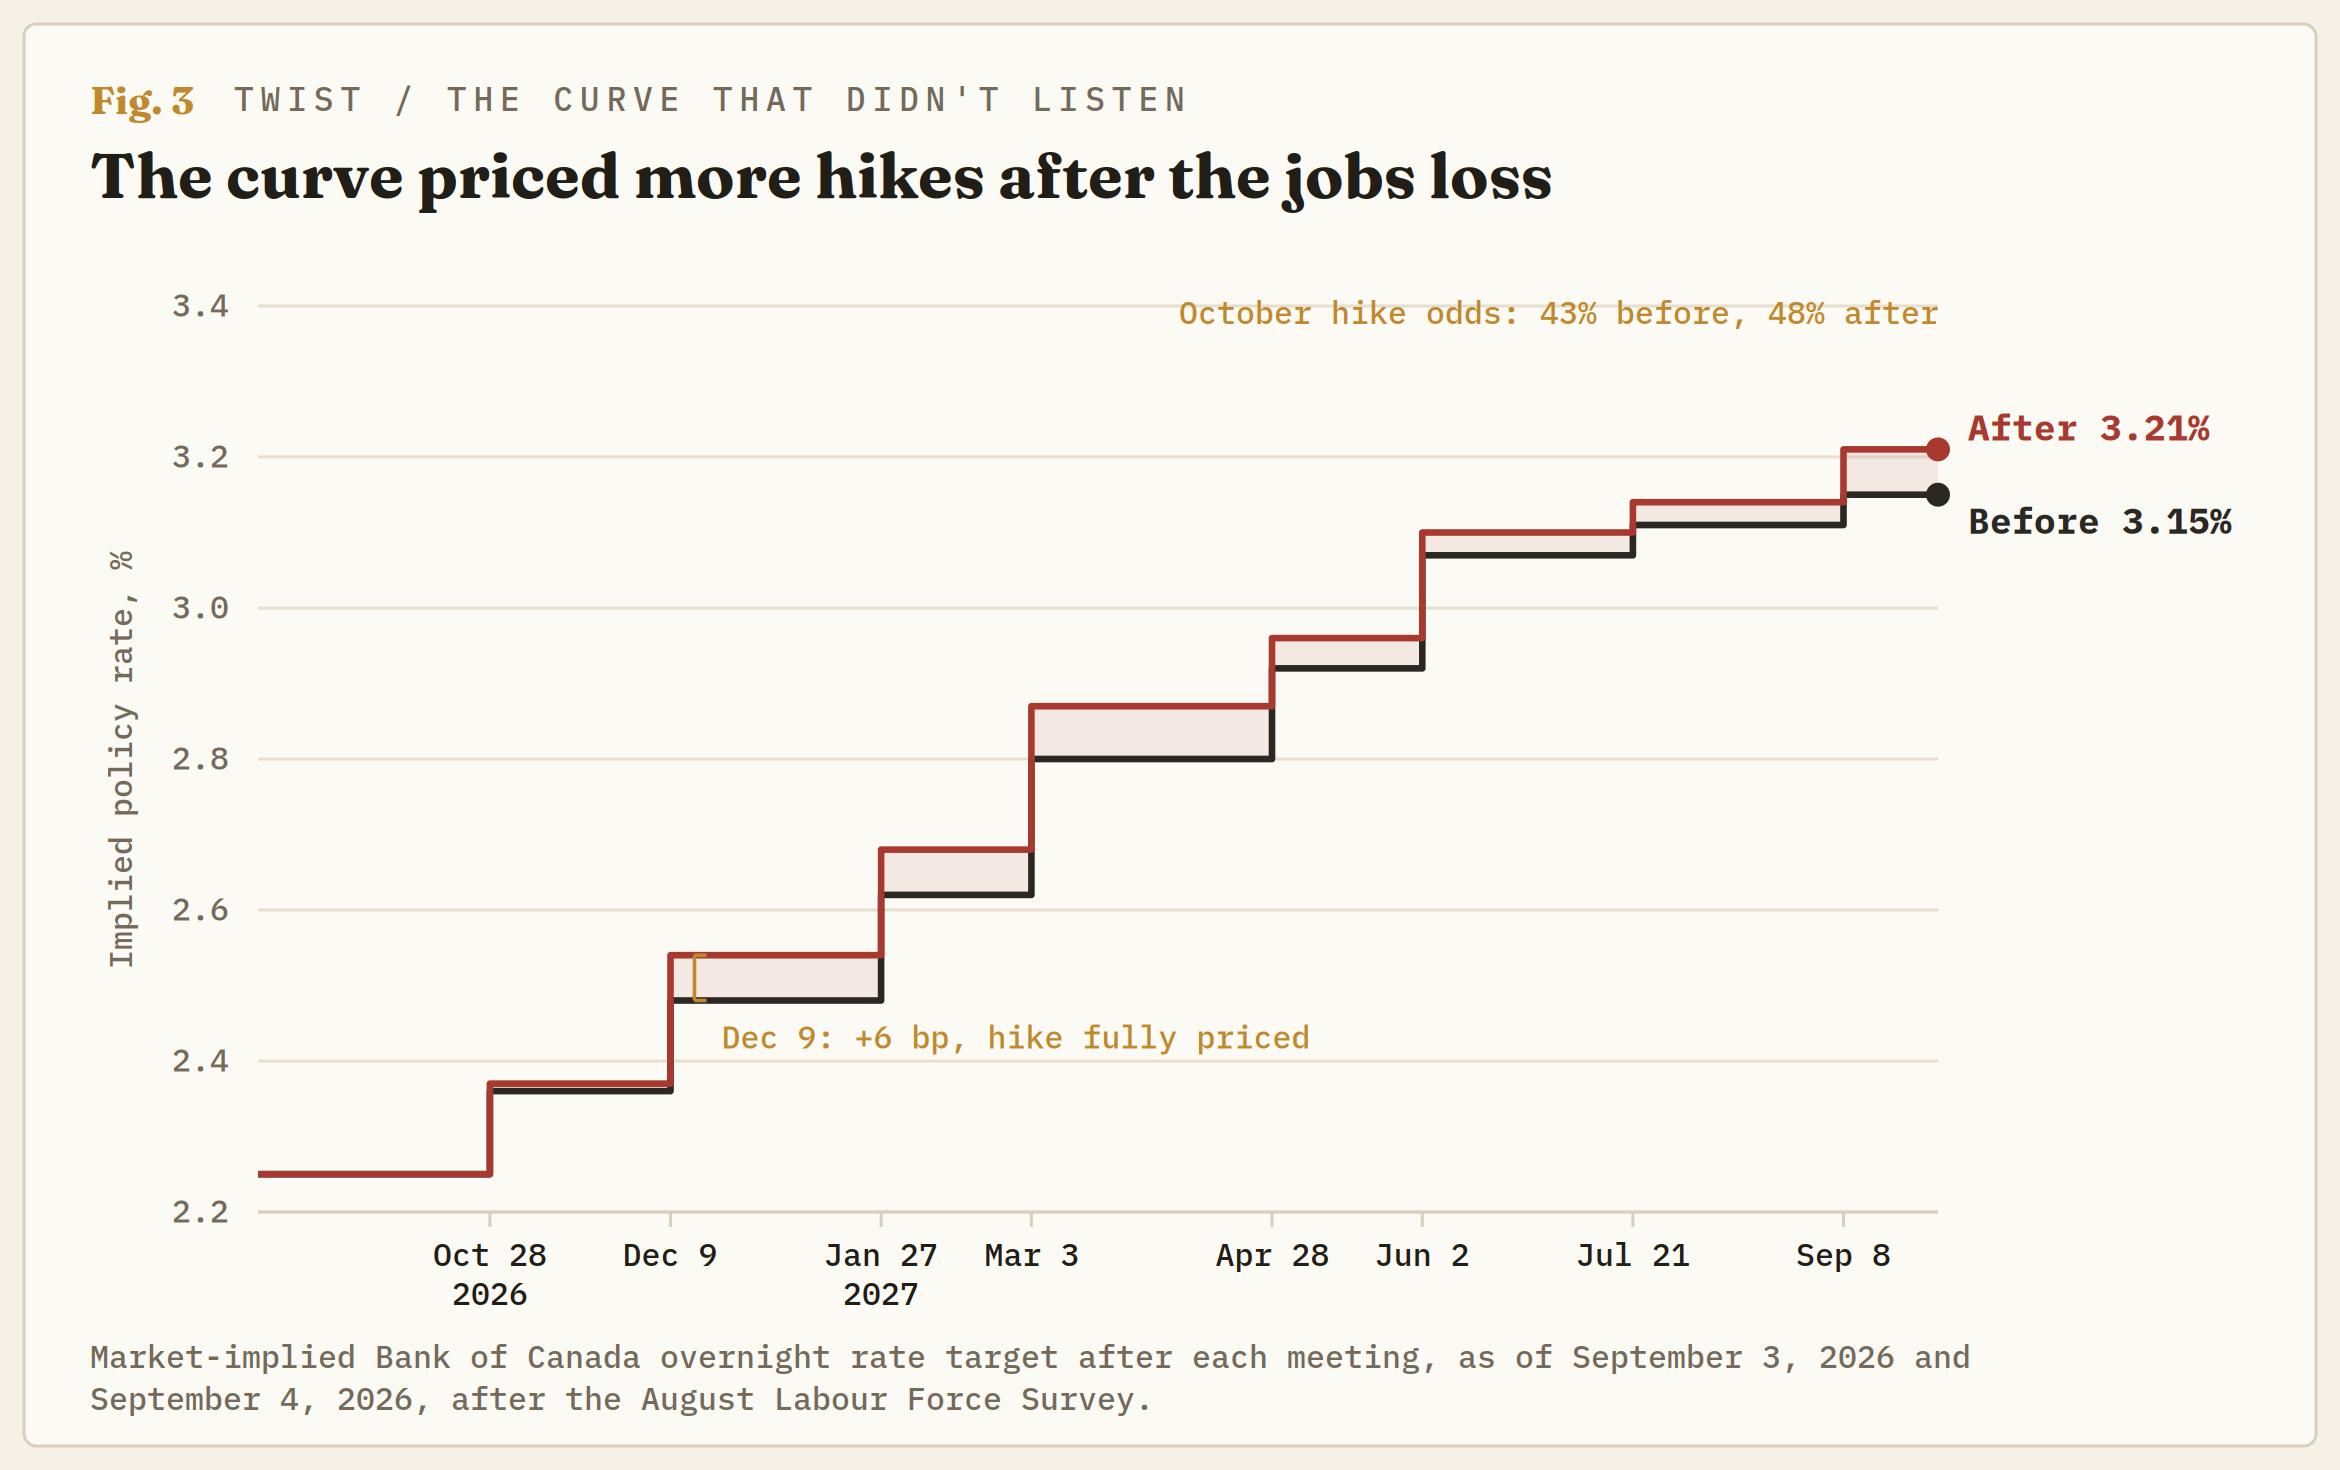
Two readings fit. The generous one is that the curve is trading the same global repricing the US print set off, and that Canadian yields have a US beta before they have a domestic one. The less generous one is that the market believes the BoC will hike into a weakening labour market because Oil and tariffs leave it no choice, which is the stagflation trade, and stagflation trades are not Loonie-positive whatever they do to the front end. Either way, the hikes being priced are forced rather than earned, and a currency doesn't get paid for forced hikes. Friday's tape is the demonstration: the Canadian curve steepened, and the Loonie fell.
The other side of the gap
The US number was strong enough to matter and softer than its headline. Payrolls rose 162K, with June and July revised up a combined 55K, taking July from a loss to a gain of 21K. Participation rose 0.2 points to 61.6%, so the 4.1% rate held for the opposite reason to Canada's: the labour force grew and the jobs absorbed it. Earnings rose 3.1% on the year. Food services added 59K and local government education 42K, the latter reversing July's drop, and information shed 23K, so roughly 100K of the gain came from two categories that swing.
It was still the hawkish print for the Federal Reserve (Fed) on September 16. FedWatch pricing went from a coin toss before the release to 58% for a quarter-point move off 3.50%-3.75%, with 87% of a hike by October 28, a second hike 45% priced by December 9 and fully priced by March 17, and a third better than even by June. Fed Chair Kevin Warsh went into the week describing the labour market as stable and inflation as the concern, and Friday gave him nothing to revise. The two banks share decision days on October 28 and December 9, US September payrolls land October 2, a week before Canada's, and the tape had spent August pricing the opposite combination. Weak Canada with strong US was the one nobody was set up for, and it's the one that printed.
The map
The reaction is a squeeze, not yet a trend: one big candle, no follow-through, and the run of lower highs since the July peak unbroken for now. The levels that change that reading are few. The 200-day exponential moving average (EMA) at 1.3900 sits directly overhead, the 50-day at 1.3950 behind it and 1.4000, lost in August, above that. Below, the floor is the pair of lows near 1.3750 from late August and Thursday, then the May base near 1.3550 and the February low near 1.3500.
The lean flips from short USD/CAD to neutral. The short was a bet on the Canadian curve outrunning the American one for the right reasons, and Friday removed the reasons while leaving the curve. A daily close above 1.3950 turns the squeeze into a trend and puts 1.4000 and the mid-August shelf near 1.4050 in play, with the July peak near 1.4250 the target for anyone who believes the Fed hikes on September 16 and the BoC hikes on October 28 into a labour market that is losing jobs. A third rejection at 1.3900 keeps the 1.3750-1.3900 range and says the market wants the August inflation print on September 14 before deciding whether the BoC's hikes are forced or imagined.
Invalidation runs the other way. Back below 1.3750 means the US print has been faded and the Canadian curve's hikes are being paid for after all, with the February low near 1.3500 the target again. Between now and October 28 the tests arrive in order: Canadian inflation on September 14, the Fed on September 16, US September payrolls on October 2 and the first tariffed LFS on October 9. The BoC published a rate statement on Wednesday that Friday's data fits better than Wednesday's did. The curve priced a hike on that statement and then priced another. One of them is reading the wrong release, and the pair has started to say which.
Author

Joshua Gibson
FXStreet
Joshua joins the FXStreet team as an Economics and Finance double major from Vancouver Island University with twelve years' experience as an independent trader focusing on technical analysis.