“Another” Bear Market?

"By the Law of Periodical Repetition, everything which has happened once must happen again, and again, and again -- and not capriciously, but at regular periods, and each thing in its own period, not another's, and each obeying its own law... The same Nature which delights in periodical repetition in the sky is the Nature which orders the affairs of the earth. Let us not underrate the value of that hint." ~ Mark Twain
Current Position of the Market
- SPX Long-term trend: A lengthy correction is most likely underway!
- SPX Intermediate trend: Brexit has most likely initiated a decline of intermediate nature.
“ANOTHER” BEAR MARKET?
Market Overview
Last week, the British people voted to leave the EU. Rarely have so many experts and professionals been so wrong about the outcome of this referendum, and its immediate impact – an estimated loss of 2+ trillion dollars in value by stock markets around the world by Friday’s close – was undoubtedly far greater than it would have been if even a neutral stance had been taken ahead of the voting. But the bookies, the polls and expert opinions could only see “remain” as the logical outcome. In the US, the Dow shed 611 points, and the SPX 76!
Janet Yellen, among many, thought that Brexit could have a negative economic impact on the world’s economies, including that of the USA, so don’t expect the bearish mood to change anytime soon since no one has a clear idea of what the full consequences of this move will be. Furthermore, it may take months, if not years, for some clarity to emerge. You know how much the stock market loves uncertainty! It is probably fair to say that those who have been predicting the onset of a bear market have their best opportunity yet, of being correct. If the selling continues for any length of time, this will also be the third attempt that prices have made to break out of their broad 1800-2135 trading range since the April 2015 high, and you know what they say about the third time … it usually succeeds! But we’ll let the market itself make that decision as we observe, analyze, and comment. For the moment, we can probably say that the weekly, daily, and hourly trends of the SPX are all down, and this will be reinforced if we break below the 2026 level decisively.
SPX Chart Analysis
Daily chart
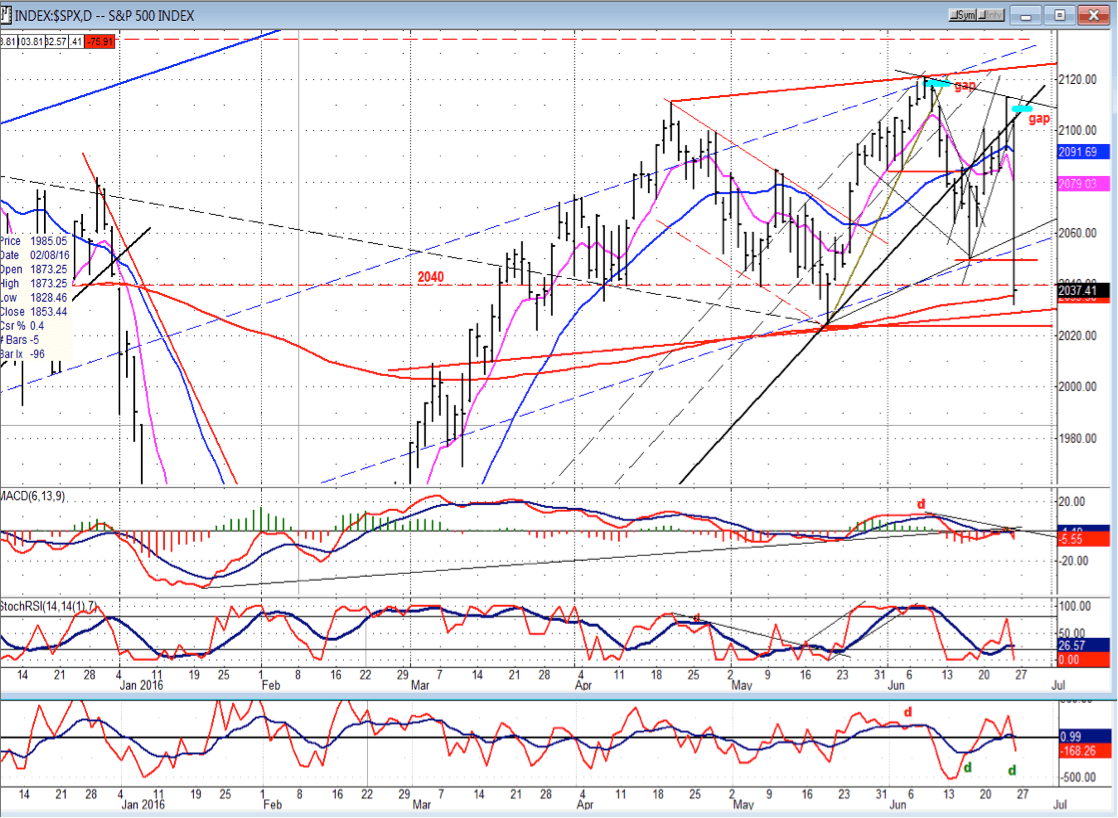
After nearly five months of rallying from 1810, SPX broke its trend line and started to correct. Deceleration had been evident for the past month and there was every reason to believe that a significant reversal was taking place. However, the initial decline found support above its recent low, and gave every indication of extending its uptrend -- probably to a new all-time high -- if Britain voted to stay in the EU. Even last Thursday, on the day that the voting took place, the index opened with a gap and closed twenty points higher, on its high of the day! Well, you know the rest. After the results started to go for “leave” the futures, which had risen to 2127 during the early session, started to drop and continued all the way down to 2007 before bargain hunters appeared and rallied them back to 2046. Selling resumed shortly afterwards, and a drop of 76 points was recorded at the close -- about the same amount as the 8/24/15 (net) decline.
SPX found support on its 233-DMA, just above the lower channel line created by a (red) parallel drawn across the two short-term tops. Since that level corresponds to a minor count across the distribution which took place over the past three days of trading, we could hold that area for a little while before dropping lower to satisfy the full short-term count. With the weekly oscillators extending their declines, and the daily and hourly oscillators rolling over, it is unlikely that the selling is over. This practically ensures that the 2026 level will be penetrated…with all the negative consequences that it implies.
If the entire three months of trading above 2026 is considered distribution, a significant downtrend lies ahead of us when that level is finally broken.
Hourly chart
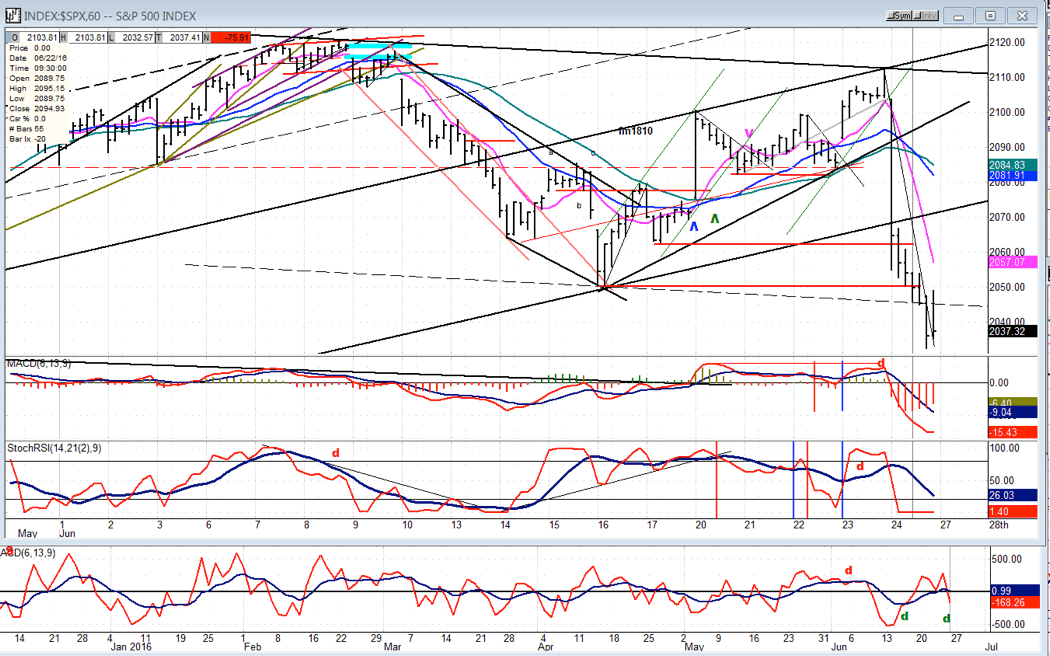
As we reached our first minor projection target of about 2031, the SPX bounced 13 points in the last hour, but it lost most of it in the last five minutes of trading, and the rest of it (and more) after the close. That should almost ensure a negative opening on Monday, especially since only a minor phase of distribution has, thus far, been satisfied. With the futures remaining near the target price, it’s possible that this will be only a partial minor corrective pattern, followed by its completion in the form of a brief rally on Monday morning. But with the fierce downside momentum, I would not bet on it unless some positive comments are made over the weekend. (I just read that petitions to the Parliament for a second referendum is now 2.7 million???)
With the brief bounce, the steep hourly downtrend finally gave us the opportunity to draw a trend line which was broken in the last hour. However, it is very steep and the normal trend usually involves at least two trend line breaks, and more often three before a reversal takes place. With the market so oversold on a near-term basis, a brief bounce is possible. Also, note that the hourly oscillator does show some positive divergence.
We need to see Monday’s opening before engaging in further short-term analysis.
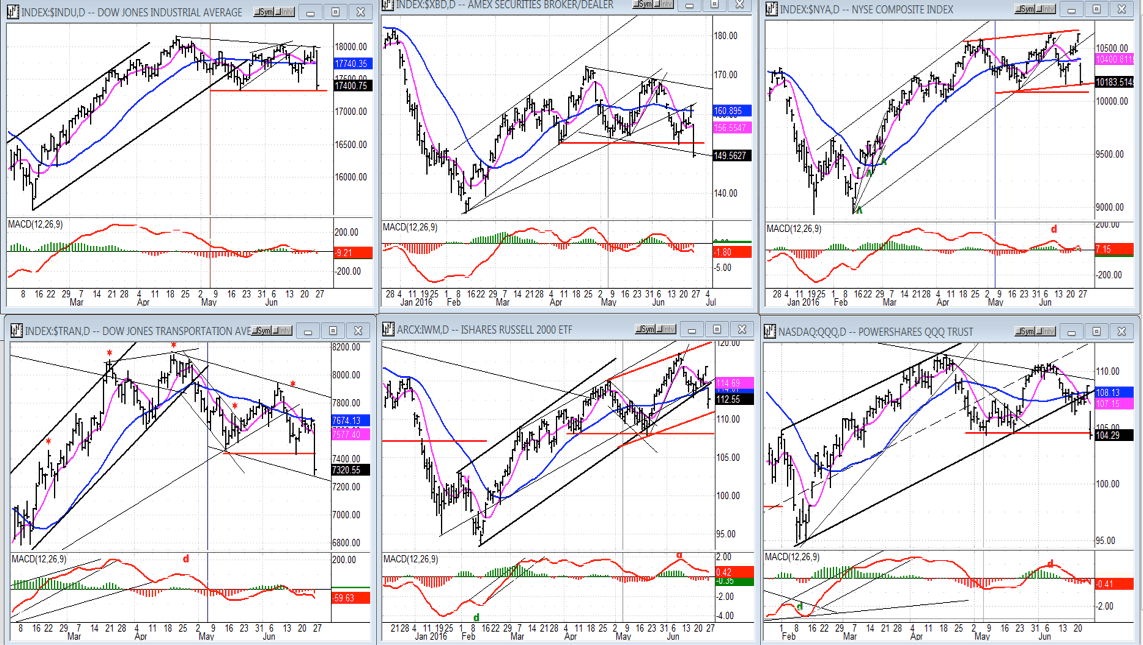
SPX et al… (daily)
Of the six leading/confirming indexes shown below, three have already broken the comparable 2026 SPX level. However, this is not sufficient to declare a permanent break. It normally takes 3 daily closes below (or above) a trend line for the penetration to be considered valid. And, if we are starting something serious, all these indices will have to participate.
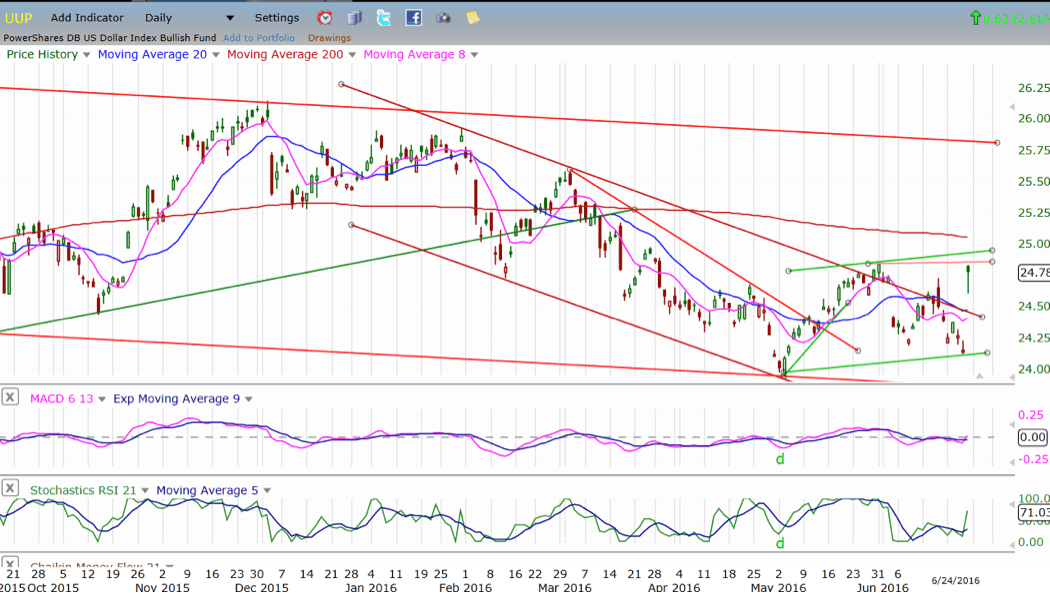
UUP (dollar ETF)
The dollar got a boost from Brexit which propelled it beyond the borders of the corrective channel. Was this a flash-in-the-pan, or a genuine attempt at resuming its uptrend? With the markets in a state of chaos, it is best to wait for the dust to settle before making solid predictions.
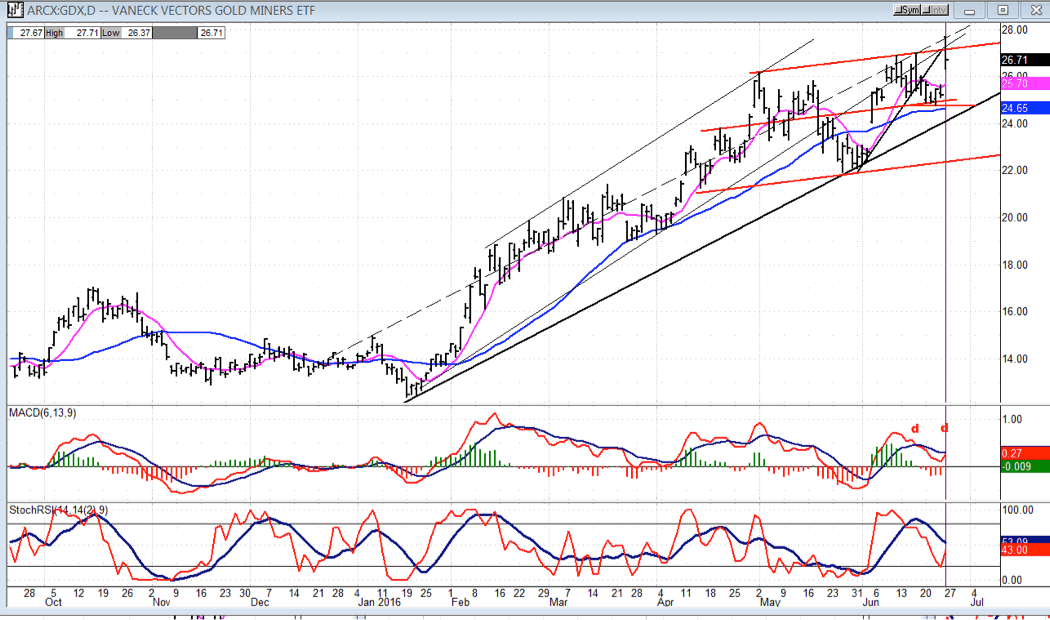
GDX (Gold Miners ETF)
I am going to start posting a chart of GDX instead of GLD. It does not follow gold tick for tick but, for those who are adventurous, it has trading ramifications which are far more interesting. Friday’s surge encountered resistance at the top of what looks like a topping formation. If this is the start of a new uptrend, it will have to clear that resistance completely and start trading outside of it. The odds are against it at the moment.
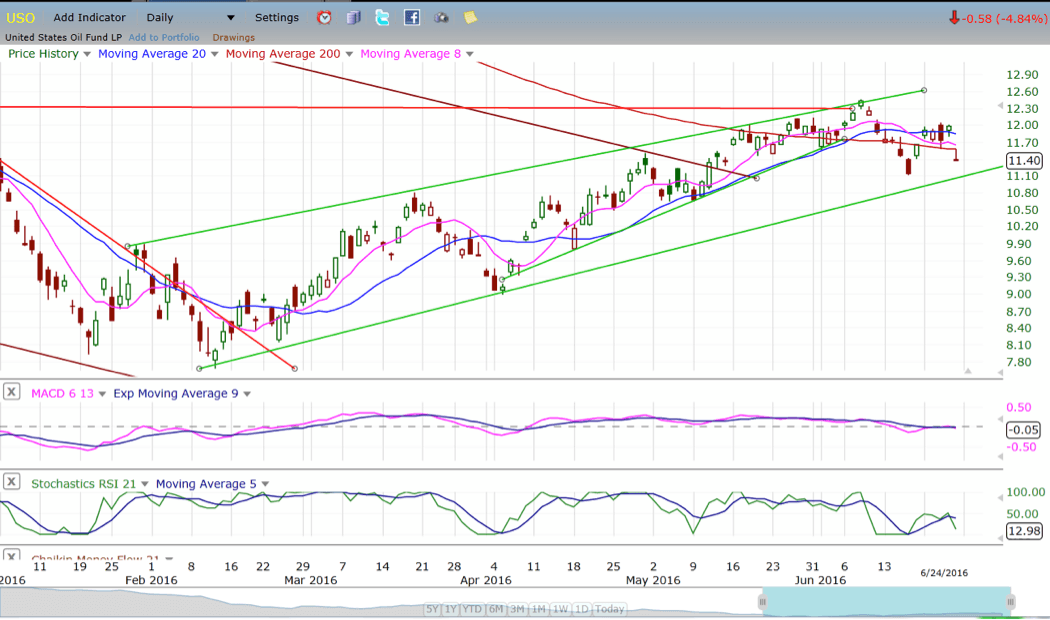
USO (US Oil Trust)
USO went the other way on Brexit. It makes sense fundamentally as well as technically. USO should now challenge its main uptrend line and, if penetrated, this would herald the beginning of a prolonged consolidation process.
Summary
“The British referendum should have a significant influence on the markets this coming week. It is best to keep from making specific predictions, especially about the intermediate trend, until after the results have been announced.”
In the light of what happened Friday, last week’s summary turned out to be words of wisdom. The prospects for the stock market bulls have dulled considerably as a result. The only thing that would change the situation would be that a second referendum would supersede the first. At this time, the possibility of this happening are bleak to none.
Author

Andre Gratian
Market Turning Points
When I was a stock broker years ago, a friend introduced me to technical analysis of the market and it is not an exaggeration to say that I fell in love with this approach! Ever since then, it has become an increasingly important


