|

XLI Elliott Wave: Buying the dips at the blue box area

In this technical blog we’re going to take a quick look at the Elliott Wave charts of XLI ETF, published in members area of the website. As our members know XLI is showing impulsive bullish structure in the cycle from the 109.9 and we have been favoring the long side of the ETF. Recently, we experienced a pullback consisting of three clear waves, which found buyers right at our buying zone (blue box). In the following text, we’ll delve into the Elliott Wave forecast and trading setup.

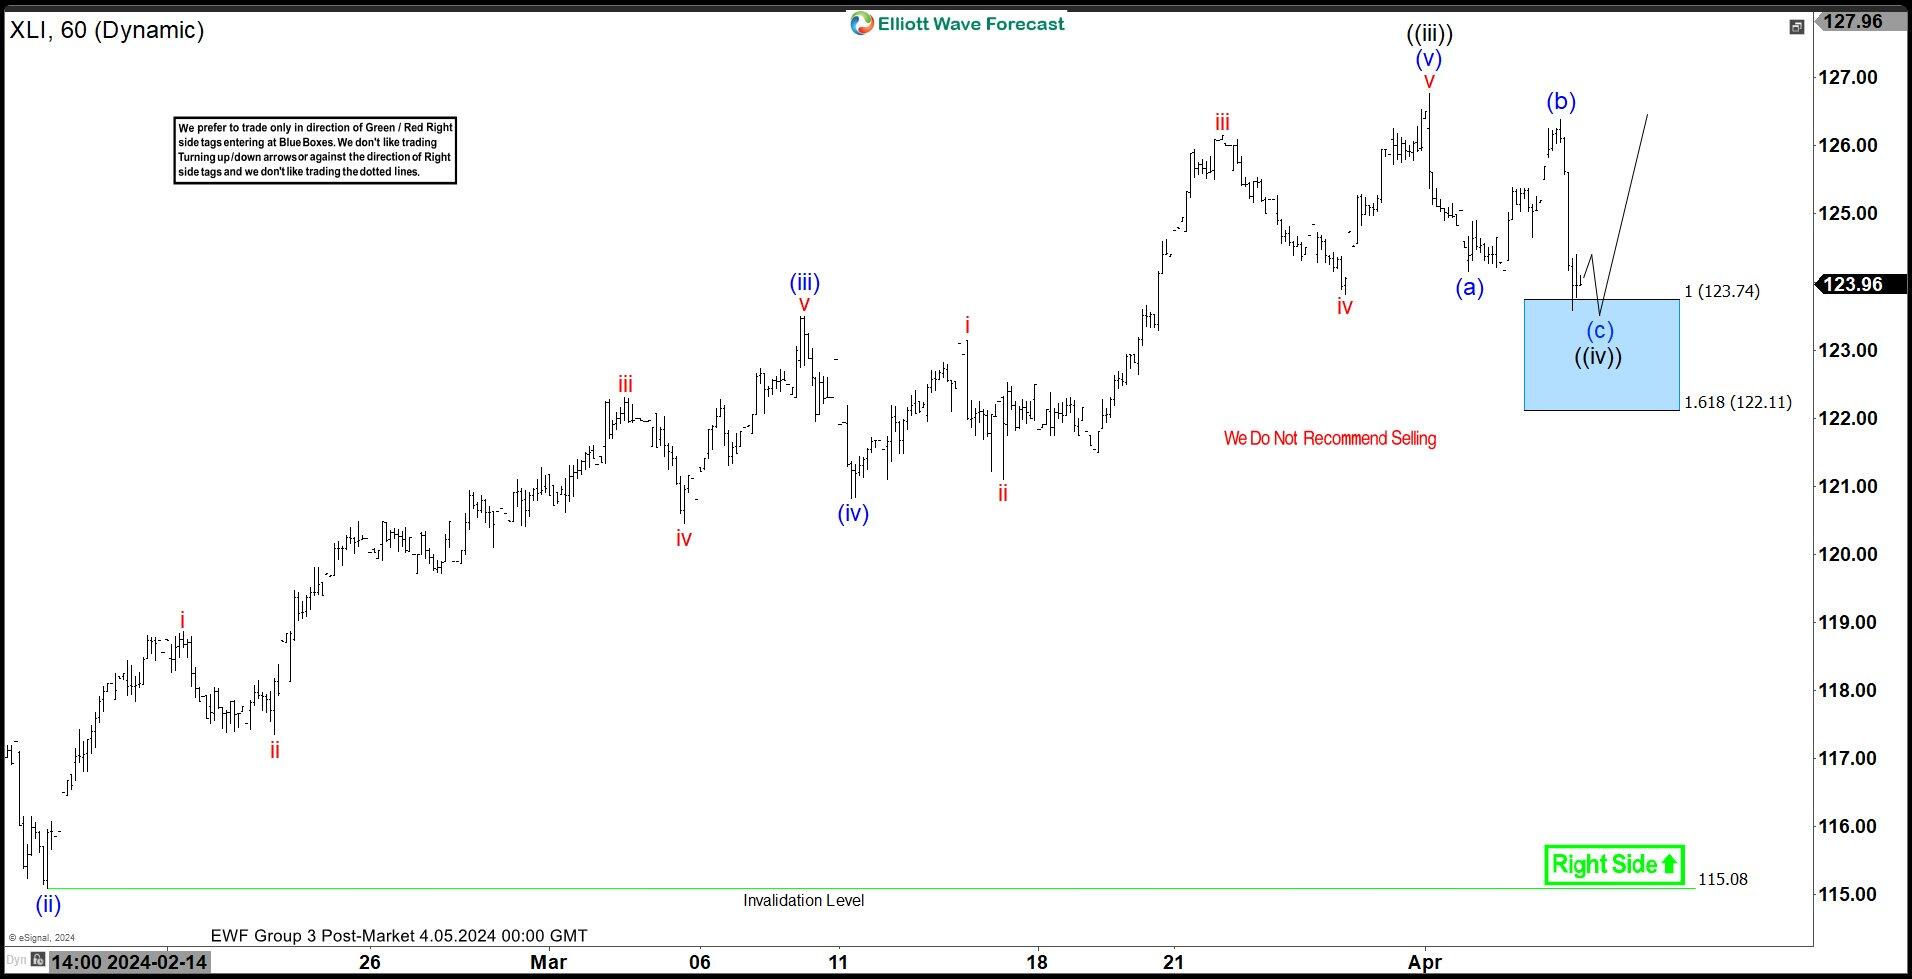
XLI one-hour post-market update 04.05.2024

The current view suggests that XLI is undergoing a wave ((iv)) correction. The pullback has reached an extreme zone within the 123.74-122.11 area, also known as the Blue Box. We acknowledge that the pullback could conclude at any moment. Therefore, we are initiating long positions within the Blue Box. Given the prevailing bullish trend, we anticipate at least a three-wave bounce from this area. Once the price touches the 50% Fibonacci retracement level against the (b) blue connector, we will secure positions, setting the stop loss at breakeven and booking partial profits. However, it’s important to note that breaking below the 1.618 Fibonacci extension level at 122.11 would invalidate the trade. We advise against selling the ETF and anticipate a further rally to resume from the buyer’s zone at 123.74-122.11.

Quick reminder on how to trade our charts :

Red bearish stamp+ blue box = Selling Setup
Green bullish stamp+ blue box = Buying Setup
Charts with Black stamps are not tradable. 

XLI

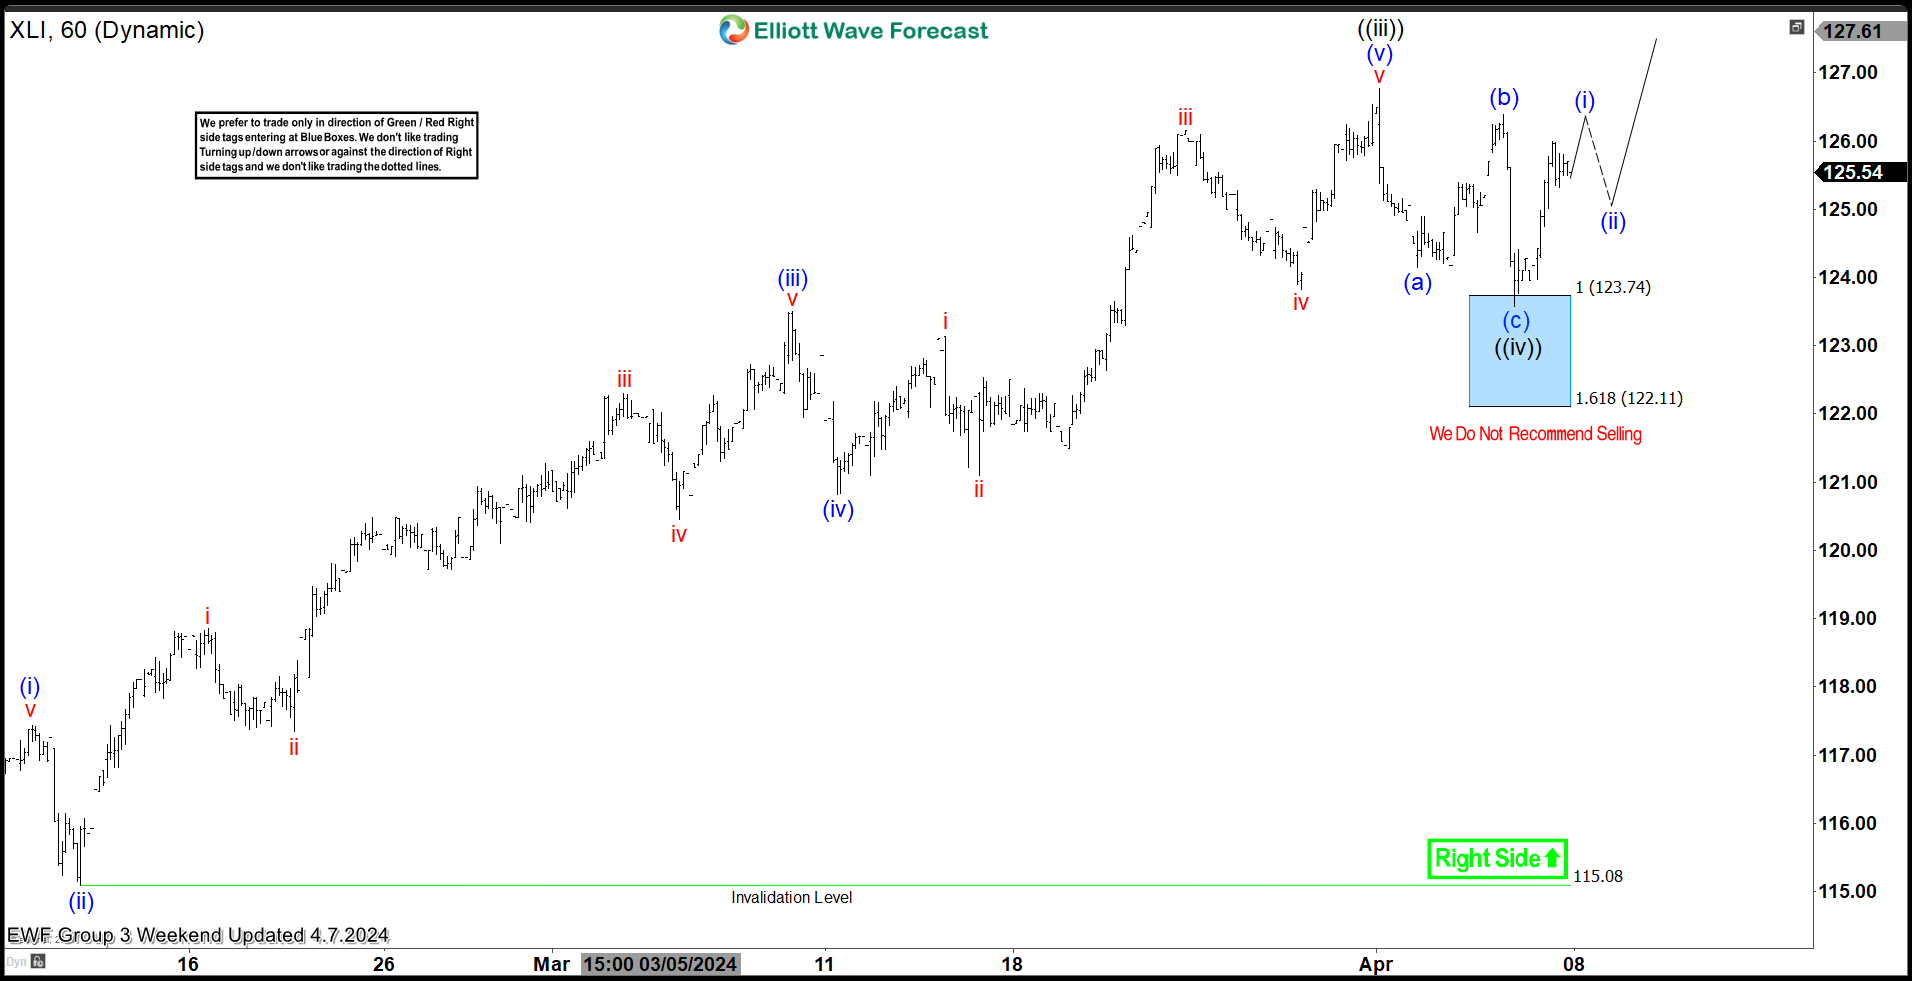
XLI one-hour weekend update 04.07.2024

XLI has given us a nice reaction from the buying zone as expected. The bounce reached and exceeded 50% Fibonacci retracement against the (b) blue high, so we consider wave ((iv)) black completed at the 123.61 low. Consequently, long positions should now be risk-free, and partial profits should be saved. We anticipate a break of the ((iii)) black peak to confirm that the next leg up is in progress. Alternatively, if the price breaks below the 123.61 low, the ETF will open up the possibility for a 7-swing pattern. In that case, long positions will be stopped out, and we will look to buy the dips again at the next set of equal legs.

XLI

Author

Elliott Wave Forecast Team

Elliott Wave Forecast Team

ElliottWave-Forecast.com

More from Elliott Wave Forecast Team
Share:

Markets move fast. We move first.

Orange Juice Newsletter brings you expert driven insights - not headlines. Every day on your inbox.

By subscribing you agree to our Terms and conditions.

Editor's Picks

EUR/USD trades around 1.1700 after rebounding from 50-day EMA

EUR/USD gains ground after three days of losses, trading around 1.1700 during the Asian hours on Wednesday. On the daily chart, technical analysis indicates a potential for a bearish bias; the 14-day Relative Strength Index at 47 confirms waning momentum.

GBP/USD consolidates around 1.3500; looks to US macro data for fresh impetus

The GBP/USD pair oscillates in a narrow range, around the 1.3500 psychological mark during the Asian session on Wednesday, and for now, seems to have stalled the previous day's retracement slide from its highest level since September 18. Moreover, the fundamental backdrop seems tilted in favor of bullish traders and suggests that the path of least resistance for spot prices is to the upside.

Gold sees profit-taking decline after facing rejection at $4,500

Gold price sees a decline on profit-taking after facing rejection at $4,500 in the Asian trading hours on Wednesday. Despite the pullback, the traditional safe haven remains underpinned by geopolitical tensions and expectations of Fed rate cuts. The US ADP Jobs data, JOLTS Job Openings Survey and ISM Services Purchasing Managers Index report will be published on Wednesday. 

Top Crypto Gainers: JasmyCoin rallies as Cosmos and Bittensor retreat

JasmyCoin, Cosmos, and Bittensor are among the top-performing cryptocurrency assets in the last 24 hours. JasmyCoin leads the rally with double-digit gains, and bulls are targeting further gains, while Cosmos and Bittensor struggle to extend their gains after six consecutive days of recovery. 

Implications of US intervention in Venezuela

Events in Venezuela are top of mind for market participants, and while developments are associated with an elevated degree of uncertainty, we are not making any changes to our markets or economic forecasts as a result of the deposition of Nicolás Maduro. 

Cardano holds steady as bulls intensify push for breakout

Cardano rises above the 50-day EMA resistance amid a risk-on mood across the crypto market. The MACD upholds positive divergence, increasing the potential for a 20% breakout to $0.505.