WTI sinks to new eight-month-lows, below $80 per barrel
- WTI tumbles more than 7.50% weekly, registering a fresh 8-month low.
- Global S&P PMIs in September increased worries of a worldwide recession, weighing on WTI.
- WTI Price Analysis: A break below $78.00 could pave the way for a fall to $70.00.

The US crude oil benchmark, also known as WTI, drops below $80.00 per barrel on Friday, amid a buoyant US Dollar, with the US Dollar Index rising to levels last seen on May 2002, a headwind for the US dollar-denominated commodity. Therefore, WTI is trading at $78.80, below its opening price by almost 6%, after hitting a daily high of $83.90.
During the week, WTI is already down by 8%, extending its decline to the fourth consecutive week. On Wednesday, the US Federal Reserve’s decision to increase rates and emphasize the need to further hikes is weighing on the black gold. That, alongside a frenzy of other central banks lifting rates, raised worldwide recession fears. Therefore oil demand would diminish.
Sources cited by Reuters said, “The crude market is under heavy selling pressure as US dollar maintains strong upward trajectory amidst more reduction in risk appetite.”
In the meantime, sentiment shifted sour, bolstering the buck. US equities are dropping between 2.13% and 3.44%, extending their weekly losses. Contrarily the US Dollar Index, a gauge of the buck’s value vs. a basket of peers, is rising 1.39% at 112.808, refreshing two-decade highs.
Adding to recessionary fears was a tranche of S&P Global PMIs, revealed during the day. The UK and the euro area PMIs, were below estimates and prepared to hit a recession, with most indices sitting in contractionary territory. In contrast, US PMIs, were mixed, though the three components improved, keeping hopes high that the US economy could dodge a recession.
Besides, as reported by a US official, the Iran nuclear deal has stalled as Tehran insists on the closure of the UN nuclear watchdog’s investigations.
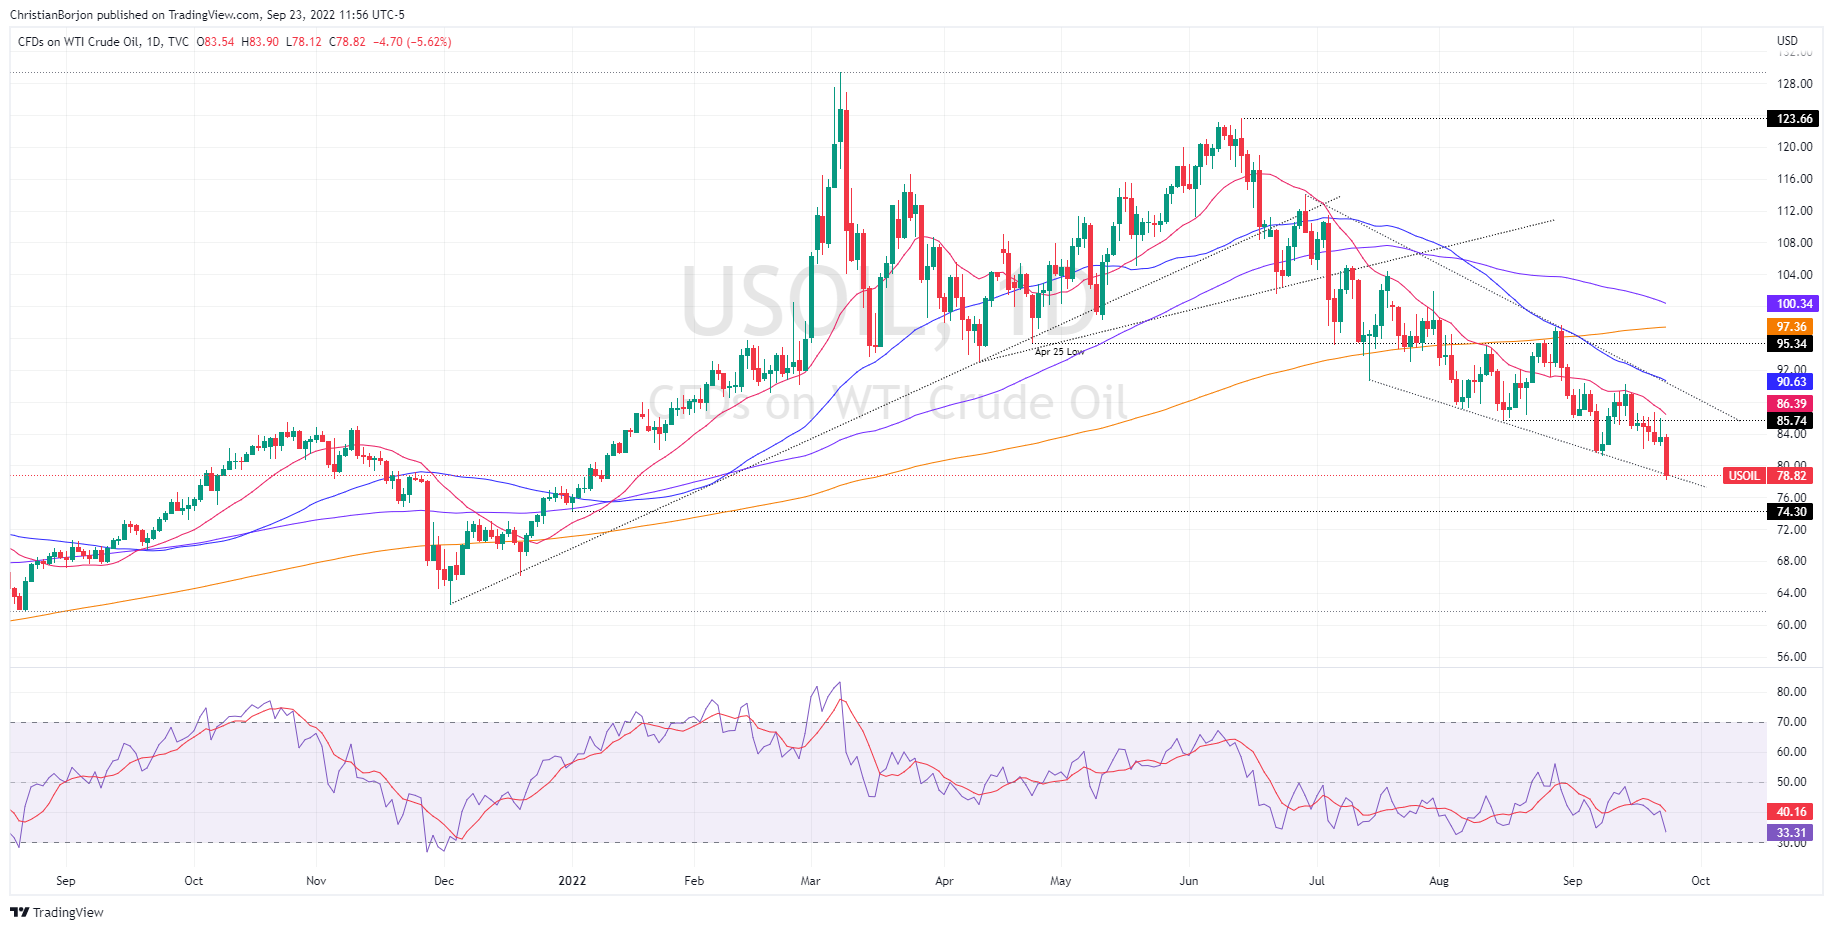
WTI Price Analysis: Technical outlook
WTI’s daily chart depicts oil price sliding below the bottom trendline of a falling wedge, which is usually a bullish signal. Therefore, US crude oil might be headed towards re-testing the January 1 and also YTD, low at $65.94. Albeit, the Relative Strength Index (RSI) sits at 33.25, in negative territory, but not in oversold conditions. So a break below $75.00 could pave the way to $70 per barrel, on its way to $65.94.
Author

Christian Borjon Valencia
FXStreet
Markets analyst, news editor, and trading instructor with over 14 years of experience across FX, commodities, US equity indices, and global macro markets.


