WTI recovers some ground and hovers at around $68.00 after plunging to a new YTD low
- WTI grinds higher after hitting a new YTD low at around $63.00.
- Global central bank tightening puts stress on oil prices with recession fears and lower demand potential.
- WTI Price Analysis: Analysis suggests relief for buyers with a rally above $70 but a potential fall to $60 is on the cards.

Western Texas Intermediate (WTI), the US crude oil price, had shrugged off a $6.00 fall during the Asian session and is trading above its opening price. Two major central banks’ decisions weighed WTI’s price, though buyers moved in and lifted prices. At the time of writing, WTI is exchanging hands at $68.72 PB, gains almost 1%.
Oil prices pressured by a global economic slowdown looming
Sentiment is still sour, blamed on the US regional bank turmoil. Further losses in the segment keep the US financial markets under stress, though a lending hand from the US Federal Reserve (Fed) could calm investors.
On Wednesday, the Fed hiked rates by 25 bps and signaled it’s ready to hold rates at the 5.00%-5.25% range. Nevertheless, Powell and Co. emphasized that inflation is elevated, the jobs market remains tight, and the Fed is ready to act if needed.
WTi reacted negatively, finishing Wednesday’s session with more than 4.50% losses. During the Asian session, risk aversion weighed on oil prices as WTI plunged to its year-to-date (YTD) low of $63.73 before bouncing off those levels.
Another factor that weighed on WTI price was that manufacturing activity in China slid, according to Caixin Global. China’s Manufacturing PMI slumped into contractionary territory, falling to 49.5 from 50 in March, and 51.6 in February, signaling that the largest Asian economy is slowing down.
Of late, the European Central Bank (ECB) increased its interest rates to 3.75%, slowing its pace of 50 bps of tightening to 25. However, the ECB’s President Christine Lagarde reiterated that the central bank is not pausing, just slowing the rhythm of tightening.
Meanwhile, given that the Organization of Petroleum Export Countries and its allies (OPEC+) began to cut its output in May, it served as a cushion for the US crude oil benchmark to stay afloat above the $60.00 mark.
Regarding US stockpiles, inventories shrank as reported by official data released by the US Energy Information Administration (EIA) on Wednesday, falling just one million barrels last week.
WTI Technical Analysis
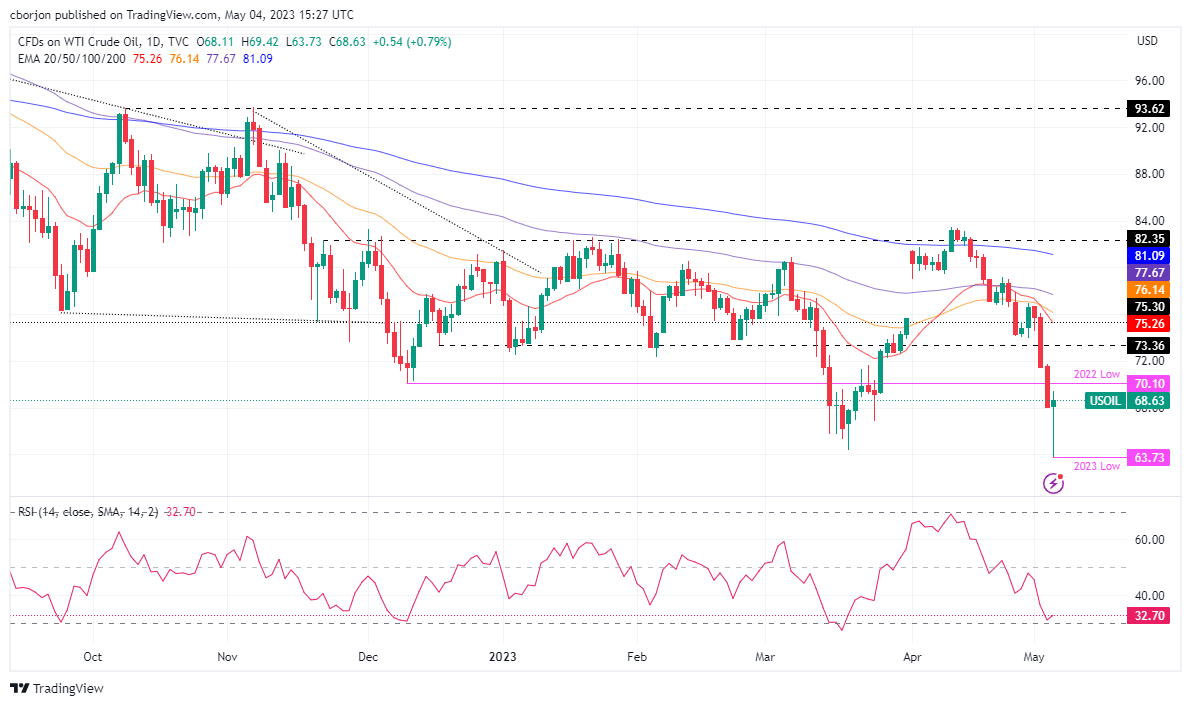
WTI is in a downtrend, and despite recovering from its earlier losses, the $60.00 mark is eyed by sellers. Unless WTI buyers reclaim last year’s low of $70.10 PB, further downside is expected. WTI’s first support would be the March 24 low of $66.86, followed by its prior’s YTD low of $64.41. Conversely, a rally above $70.00 could offer buyers a respite, though downside risks remain as it stays below $75.00.
Author

Christian Borjon Valencia
FXStreet
Markets analyst, news editor, and trading instructor with over 14 years of experience across FX, commodities, US equity indices, and global macro markets.


