WTI Price Forecast: Oil eases after failed attempt to reclaim $63 handle
- WTI edges lower on Monday, trimming earlier gains after facing stiff resistance near $63.00.
- OPEC+ agrees to raise output by 137,000 bpd from October 2025, beginning the rollback of 1.65 million bpd in voluntary cuts.
- The EU is preparing a 19th sanctions package on Russia with the US, targeting banks and Oil trade, adding a geopolitical risk premium.

WTI (West Texas Intermediate) Crude Oil edges lower on Monday, trimming earlier gains after a brief rebound from last week’s three-month low. At the time of writing, WTI is trading near $61.80 per barrel during the American session, as traders weigh OPEC+’s modest output hike alongside fresh European Union (EU) sanctions risks.
OPEC+ met on Sunday and agreed to raise output by 137,000 barrels per day starting in October 2025, marking the first step in unwinding its voluntary production cuts of 1.65 million bpd. The move is noticeably smaller than recent monthly hikes of more than 500,000 bpd, underscoring the group’s cautious approach. By opting for a modest increase, the alliance signaled its intent to gradually reclaim market share while avoiding a sharp oversupply at a time when global demand indicators remain fragile.
Meanwhile, political headlines are adding to the mix. EU foreign policy chief António Costa confirmed on Monday that the bloc is preparing its 19th package of sanctions against Russia in close coordination with the United States. EU and United States (US) officials are discussing a new package that could target Russian banks and tighten restrictions on Oil trade, including measures aimed at curbing the use of shadow tankers and sanction-evasion channels.
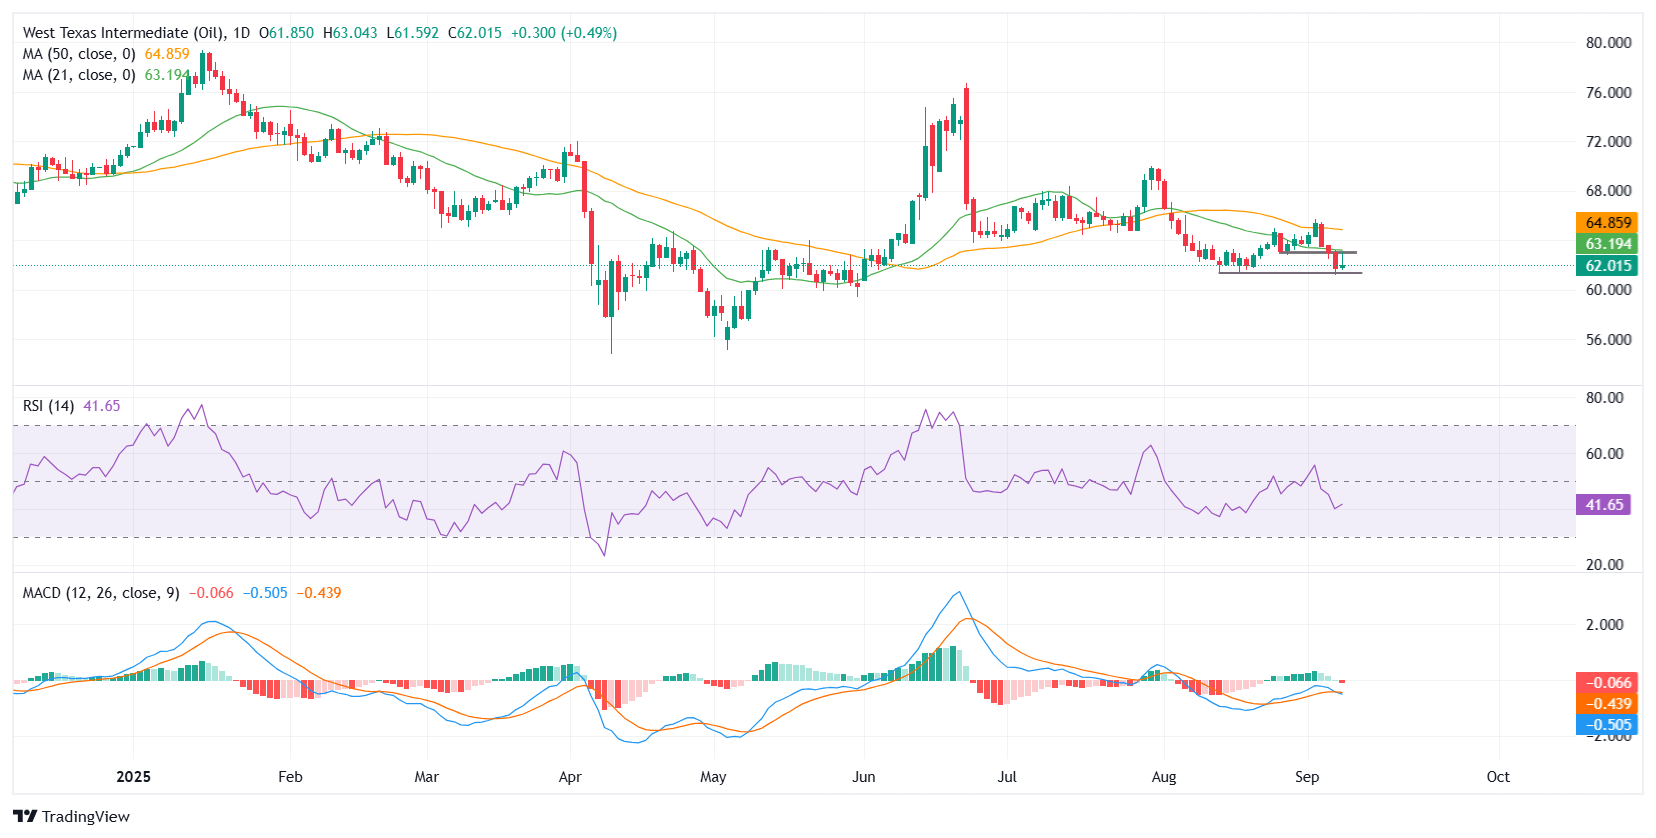
From a technical perspective, WTI is attempting to stabilize above the $62.00 support zone after last week’s sell-off. The rebound faced a horizontal resistance around $63.00, a former support level that closely aligns with the 21-period Simple Moving Average (SMA) at 62.85. A decisive break above this area would strengthen bullish momentum and open the way toward the 50-period SMA near 63.66 and the $64.00 handle. On the flip side, failure to clear $63.00 could see WTI slip back toward $62.00, with further weakness exposing the strong support zone around $61.50-61.00.
Momentum indicators point to a tentative recovery. The Relative Strength Index (RSI) at 44.20 is climbing from oversold territory but remains below the neutral 50 mark, suggesting bulls are regaining ground cautiously but lack firm control for now. The Moving Average Convergence Divergence (MACD) on the 4-hour chart is showing early signs of a bullish crossover, with the histogram turning slightly positive, hinting that upward momentum may be starting to build.
Overall, unless WTI marks a clear break above $63.00, the short-term path of least resistance remains to the downside, with risks of a retest of $62.00 and the $61.50-61.00 support zone.
WTI Oil FAQs
WTI Oil is a type of Crude Oil sold on international markets. The WTI stands for West Texas Intermediate, one of three major types including Brent and Dubai Crude. WTI is also referred to as “light” and “sweet” because of its relatively low gravity and sulfur content respectively. It is considered a high quality Oil that is easily refined. It is sourced in the United States and distributed via the Cushing hub, which is considered “The Pipeline Crossroads of the World”. It is a benchmark for the Oil market and WTI price is frequently quoted in the media.
Like all assets, supply and demand are the key drivers of WTI Oil price. As such, global growth can be a driver of increased demand and vice versa for weak global growth. Political instability, wars, and sanctions can disrupt supply and impact prices. The decisions of OPEC, a group of major Oil-producing countries, is another key driver of price. The value of the US Dollar influences the price of WTI Crude Oil, since Oil is predominantly traded in US Dollars, thus a weaker US Dollar can make Oil more affordable and vice versa.
The weekly Oil inventory reports published by the American Petroleum Institute (API) and the Energy Information Agency (EIA) impact the price of WTI Oil. Changes in inventories reflect fluctuating supply and demand. If the data shows a drop in inventories it can indicate increased demand, pushing up Oil price. Higher inventories can reflect increased supply, pushing down prices. API’s report is published every Tuesday and EIA’s the day after. Their results are usually similar, falling within 1% of each other 75% of the time. The EIA data is considered more reliable, since it is a government agency.
OPEC (Organization of the Petroleum Exporting Countries) is a group of 12 Oil-producing nations who collectively decide production quotas for member countries at twice-yearly meetings. Their decisions often impact WTI Oil prices. When OPEC decides to lower quotas, it can tighten supply, pushing up Oil prices. When OPEC increases production, it has the opposite effect. OPEC+ refers to an expanded group that includes ten extra non-OPEC members, the most notable of which is Russia.
Author

Vishal Chaturvedi
FXStreet
I am a macro-focused research analyst with over four years of experience covering forex and commodities market. I enjoy breaking down complex economic trends and turning them into clear, actionable insights that help traders stay ahead of the curve.


