WTI Price Analysis: Stuck in a triangle around $53.00
- WTI seesaws around $53.00 while staying above 100/200-HMA.
- Upbeat RSI conditions, sustained trading beyond the key moving averages favor buyers.

WTI eases to $53.01 during the initial Asian trading on Friday. Even so, the energy benchmark keeps the previous day’s bounce off 100 and 200-HMAs inside a nine-day-old symmetrical triangle.
Considering the upbeat RSI conditions and the quote’s ability to stay above important moving averages, WTI buyers are up for challenging the resistance line of the stated triangle, at $53.65.
However, the $54.00 threshold and the February 2020 peak surrounding $54.70 are likely strong resistance to challenge the oil buyers.
On the downside, a clear break below the key HMAs, currently around $52.85-80, could question the triangle support, at $52.05 now. Also acting as the short-term support is the $52.00 round-figure.
In a case where the black gold drops below $52.00, sellers can eye for $51.30 and $51.00 ahead of the $50.00 psychological magnet and the monthly low near $47.25.
WTI hourly chart
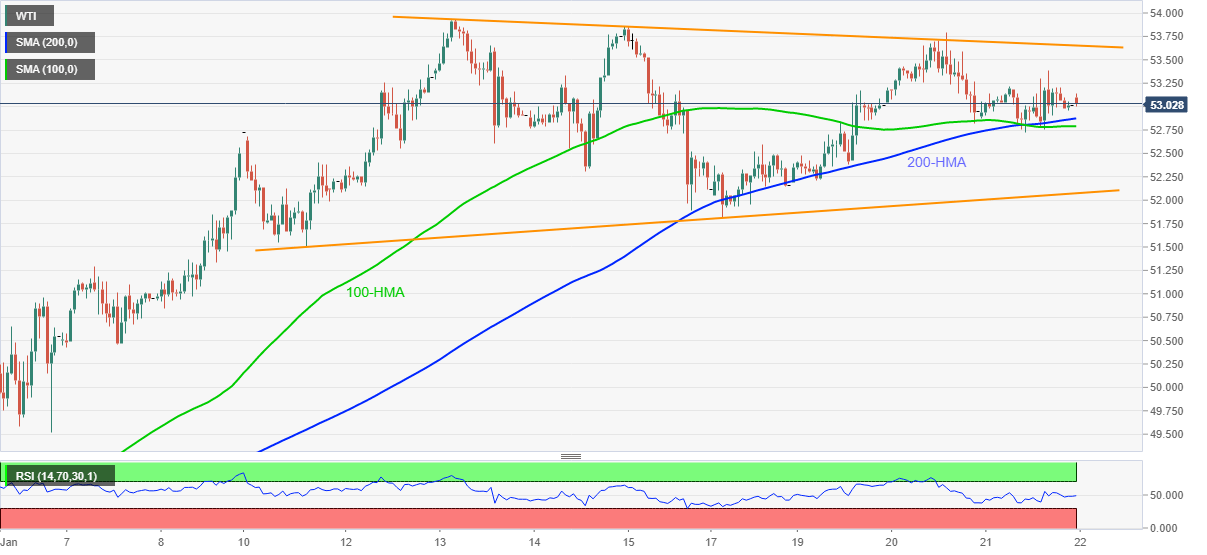
Trend: Sideways
Author

Anil Panchal
FXStreet
Anil Panchal has nearly 15 years of experience in tracking financial markets. With a keen interest in macroeconomics, Anil aptly tracks global news/updates and stays well-informed about the global financial moves and their implications.


