|

WTI Price Analysis: Retraces from $59.80 amid a potential symmetrical triangle breakout

  • WTI trades below $59.70, the ascending trendline on the 4H chart.
  • A symmetrical triangle points toward a bearish breakout.
  • However, neutral momentum oscillator warrants caution for aggressive bids.

WTI trades with a softer tone on Monday following the previous week’s subdued price action. Crude oil moves in a narrow trade band where lows are restricted around the $59.10 neighborhood and the highs near the $59.75 region.

At the time of writing, the US oil is trading at $59.34, up 0,07% on the day.

WTI Four-hour chart

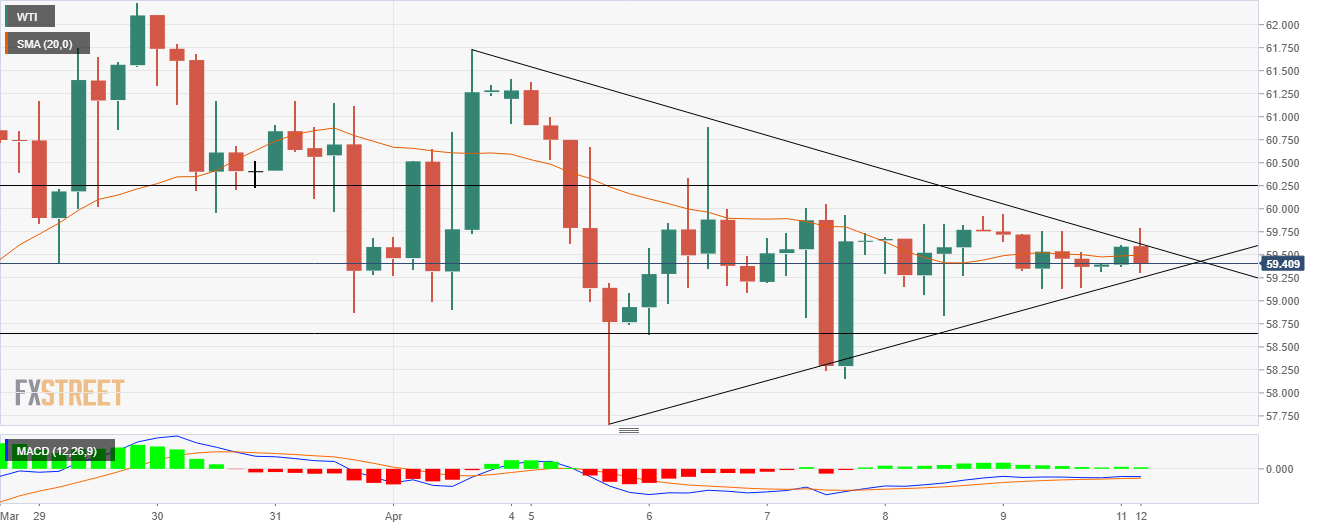
On the four-hourly chart, the formation of a symmetrical triangle suggests that a breakout could happen on either side of the cross. However, the bias remains to the downside. The price is just placed above the 20-hour simple moving average (SMA).

On the downside, the price would move towards the $58.75 horizontal support level first and then it could find the next support near $57.63. This would also coincide with the breach of the ascending trendline further opening the path towards weekly lows near the $57.65 level.

The Moving Average Convergence Divergence (MACD) momentous oscillator reads below the midline with a bullish crossover, which throws some caution for the bears.

On the flip side, if the price is starting to move beyond the 20-hour SMA, which is placed at $59.50, then it would negate the possibility of a bearish breakout, pushing the prices toward a $60.25 horizontal resistance zone. The next hurdle appears to be last week’s tops of $61.50.

WTI additional levels

WTI

Overview
Today last price59.30
Today Daily Change-0.05
Today Daily Change %-0.08
Today daily open59.39
 
Trends
Daily SMA2060.98
Daily SMA5060.47
Daily SMA10054.58
Daily SMA20047.59
 
Levels
Previous Daily High59.94
Previous Daily Low59.13
Previous Weekly High61.41
Previous Weekly Low57.66
Previous Monthly High67.87
Previous Monthly Low57.27
Daily Fibonacci 38.2%59.44
Daily Fibonacci 61.8%59.63
Daily Pivot Point S159.03
Daily Pivot Point S258.68
Daily Pivot Point S358.22
Daily Pivot Point R159.85
Daily Pivot Point R260.3
Daily Pivot Point R360.66

Author

More from FXStreet Team
Share:

Editor's Picks

EUR/USD trims gains, back below 1.1800

EUR/USD now loses some upside momentum, returning to the area below the 1.1800 support as the Greenback manages to regain some composure following the SCOTUS-led pullback earlier in the session.

GBP/USD off highs, recedes to the sub-1.3500 area

Following earlier highs north of 1.3500 the figure, GBP/USD now faces some renewed downside pressure, revisiting the 1.3490 zone as the US Dollar manages to regain some upside impulse in the latter part of the NA session on Friday.

Gold climbs to weekly tops, approaches $5,100/oz

Gold keeps the bid tone well in place at the end of the week, now hitting fresh weekly highs and retargeting the key $5,100 mark per troy ounce. The move higher in the yellow metal comes in response to ongoing geopolitical tensions in the Middle East and modest losses in the US Dollar.

Crypto Today: Bitcoin, Ethereum, XRP rebound as risk appetite improves

Bitcoin rises marginally, nearing the immediate resistance of $68,000 at the time of writing on Friday. Major altcoins, including Ethereum and Ripple, hold key support levels as bulls aim to maintain marginal intraday gains.

Week ahead – Markets brace for heightened volatility as event risk dominates

Dollar strength dominates markets as risk appetite remains subdued. A Supreme Court ruling, geopolitics and Fed developments are in focus. Pivotal Nvidia earnings on Wednesday as investors question tech sector weakness.

Ripple bulls defend key support amid waning retail demand and ETF inflows

XRP ticks up above $1.40 support, but waning retail demand suggests caution. XRP attracts $4 million in spot ETF inflows on Thursday, signaling renewed institutional investor interest.