WTI Price Analysis: Oil portrays corrective bounce above $67.00 but bears keep control


  • WTI portrays corrective bounce from the lowest levels since December 2021.
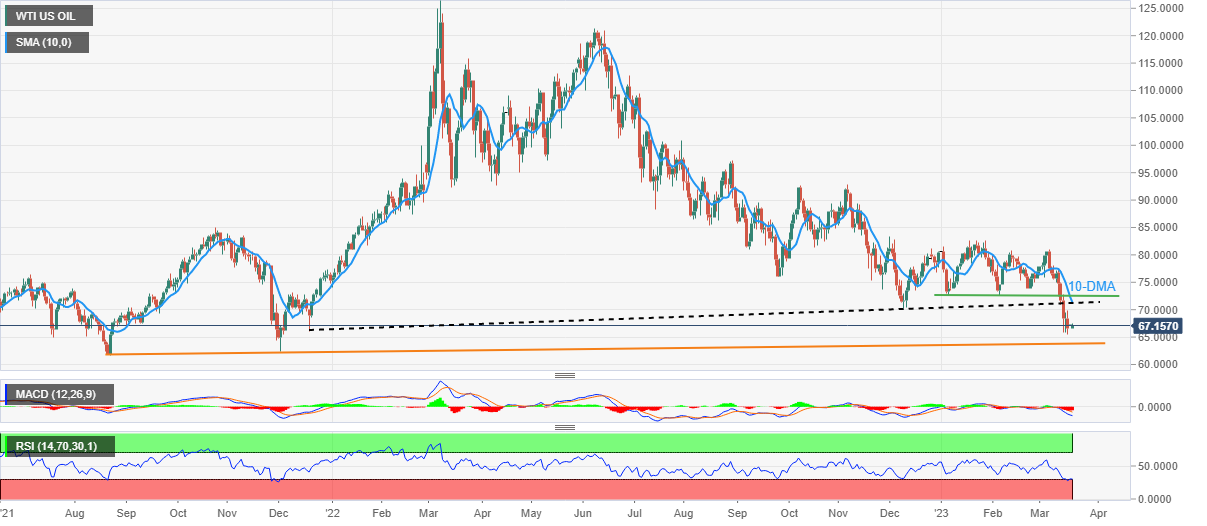
  • Oversold RSI favors recovery but convergence of 10-DMA, previous support line from late 2021 probe buyers.
  • 19-month-old ascending support line lures sellers amid bearish MACD signals.

WTI crude oil picks up bids to consolidate recent losses around $67.15 during Monday’s Asian session. In doing so, the black gold bounces off the 15-month low marked the previous day amid oversold RSI conditions.

However, the energy benchmark remains well below the previous key support confluence comprising the 10-DMA and an upward-sloping support line from December 2021, now resistance near $71.20-30.

It should be noted, however, that the latest rebound could aim for $70.00.

That said, a horizontal area comprising multiple levels marked since early January, around $72.70, appears the key hurdle for the WTI bulls to cross to retake control.

Following that, the mid-month high of around $77.55 could lure the WTI crude oil buyers.

Alternatively, a fresh downside could aim for the latest bottom surrounding $65.45 before aiming for the December 2021 low of around $62.30.

It’s worth mentioning that an upward-sloping trend line from August 2021, around 62.30, also appears the key downside filter to watch for the Oil bears.

Should the quote remains bearish past $62.30, a slump towards the August 2021 bottom of $61.80, as well as to the $60.00 round figure, can’t be ruled out.

WTI: Daily chart

Trend: Further downside expected  

Additional important levels

Overview
Today last price 67.27
Today Daily Change 0.70
Today Daily Change % 1.05%
Today daily open 66.57
 
Trends
Daily SMA20 75.24
Daily SMA50 77.24
Daily SMA100 78.59
Daily SMA200 85.58
 
Levels
Previous Daily High 69.83
Previous Daily Low 65.44
Previous Weekly High 77.55
Previous Weekly Low 65.44
Previous Monthly High 80.75
Previous Monthly Low 72.5
Daily Fibonacci 38.2% 67.12
Daily Fibonacci 61.8% 68.15
Daily Pivot Point S1 64.73
Daily Pivot Point S2 62.89
Daily Pivot Point S3 60.34
Daily Pivot Point R1 69.12
Daily Pivot Point R2 71.67
Daily Pivot Point R3 73.5


Share: Feed news

Information on these pages contains forward-looking statements that involve risks and uncertainties. Markets and instruments profiled on this page are for informational purposes only and should not in any way come across as a recommendation to buy or sell in these assets. You should do your own thorough research before making any investment decisions. FXStreet does not in any way guarantee that this information is free from mistakes, errors, or material misstatements. It also does not guarantee that this information is of a timely nature. Investing in Open Markets involves a great deal of risk, including the loss of all or a portion of your investment, as well as emotional distress. All risks, losses and costs associated with investing, including total loss of principal, are your responsibility. The views and opinions expressed in this article are those of the authors and do not necessarily reflect the official policy or position of FXStreet nor its advertisers. The author will not be held responsible for information that is found at the end of links posted on this page.

If not otherwise explicitly mentioned in the body of the article, at the time of writing, the author has no position in any stock mentioned in this article and no business relationship with any company mentioned. The author has not received compensation for writing this article, other than from FXStreet.

FXStreet and the author do not provide personalized recommendations. The author makes no representations as to the accuracy, completeness, or suitability of this information. FXStreet and the author will not be liable for any errors, omissions or any losses, injuries or damages arising from this information and its display or use. Errors and omissions excepted.

The author and FXStreet are not registered investment advisors and nothing in this article is intended to be investment advice.

Recommended content


Recommended content

Editors’ Picks

EUR/USD regains traction, recovers above 1.0700

EUR/USD regains traction, recovers above 1.0700

EUR/USD regained its traction and turned positive on the day above 1.0700 in the American session. The US Dollar struggles to preserve its strength after the data from the US showed that the economy grew at a softer pace than expected in Q1.

EUR/USD News

GBP/USD returns to 1.2500 area in volatile session

GBP/USD returns to 1.2500 area in volatile session

GBP/USD reversed its direction and recovered to 1.2500 after falling to the 1.2450 area earlier in the day. Although markets remain risk-averse, the US Dollar struggles to find demand following the disappointing GDP data.

GBP/USD News

Gold climbs above $2,340 following earlier drop

Gold climbs above $2,340 following earlier drop

Gold fell below $2,320 in the early American session as US yields shot higher after the data showed a significant increase in the US GDP price deflator in Q1. With safe-haven flows dominating the markets, however, XAU/USD reversed its direction and rose above $2,340.

Gold News

XRP extends its decline, crypto experts comment on Ripple stablecoin and benefits for XRP Ledger

XRP extends its decline, crypto experts comment on Ripple stablecoin and benefits for XRP Ledger

Ripple extends decline to $0.52 on Thursday, wipes out weekly gains. Crypto expert asks Ripple CTO how the stablecoin will benefit the XRP Ledger and native token XRP. 

Read more

After the US close, it’s the Tokyo CPI

After the US close, it’s the Tokyo CPI

After the US close, it’s the Tokyo CPI, a reliable indicator of the national number and then the BoJ policy announcement. Tokyo CPI ex food and energy in Japan was a rise to 2.90% in March from 2.50%.

Read more

Forex MAJORS

Cryptocurrencies

Signatures