WTI Price Analysis: Firmer below $75.00 on the way to six-week-old resistance
- WTI stays on the front foot around the highest levels since October 2018.
- Extension of rebound from 10-DMA, upbeat MACD favor bulls.
- Ascending trend line from late May adds to the downside filters.

WTI picks up bids near the intraday top of $74.80, up 0.38% on a day, during early Friday. The black gold refreshed the multi-day top the previous day while extending the early week’s U-turn from 10-DMA.
Given the commodity’s sustained trading beyond the 10-DMA level of $73.40, not to forget an upward sloping support line from May 17, near $72.60, WTI is up for battling the key resistance line close to the $76.00 threshold.
However, the recent high near $75.70 and the year 2018 top close to $76.90 offers extra filters during the uptrend.
Meanwhile, pullback moves remain less worrisome until staying beyond the stated support line close to $72.60, a break of which could recall the $70.00 psychological magnet to the chart.
Though, the quote’s downside past $70.00 will be probed by March’s top surrounding $67.90.
Overall, WTI remains bullish but the stated resistance line may offer intermediate pullbacks to trade.
WTI daily chart
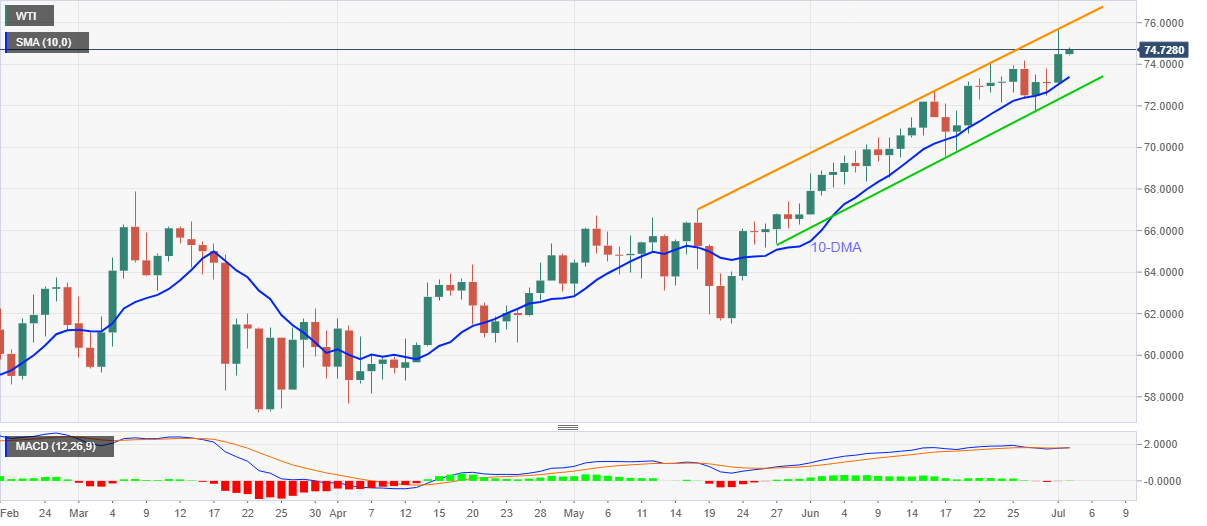
Trend: Bullish
Author

Anil Panchal
FXStreet
Anil Panchal has nearly 15 years of experience in tracking financial markets. With a keen interest in macroeconomics, Anil aptly tracks global news/updates and stays well-informed about the global financial moves and their implications.


