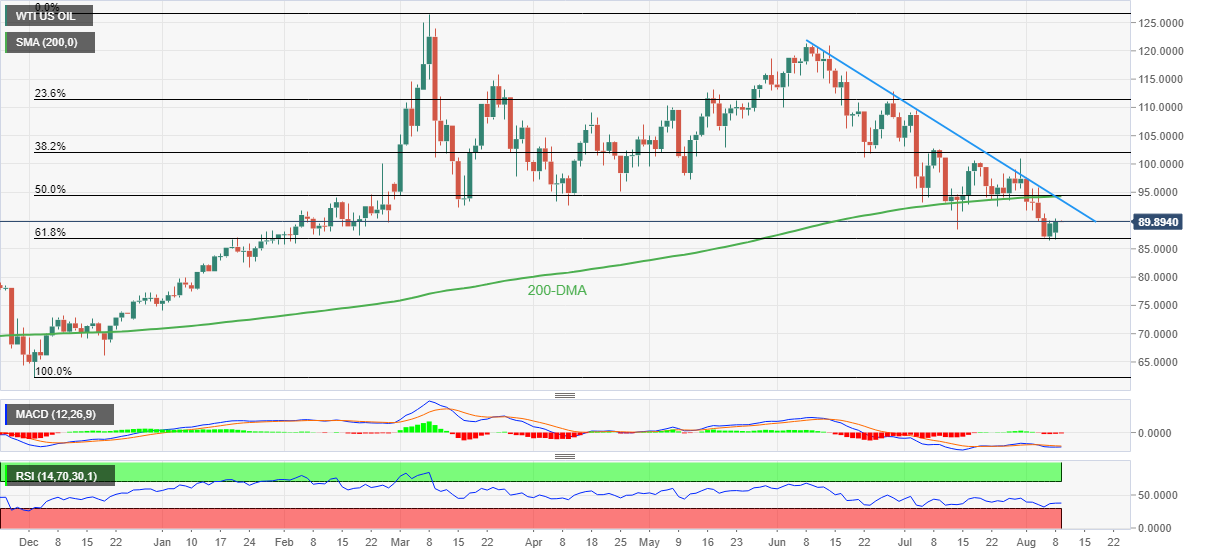
WTI Price Analysis: Defends bounce off 61.8% Fibonacci retracement around $90.00
- WTI grinds higher after bouncing off the key Fibonacci retracement support.
- Sluggish RSI, MACD challenge further upside momentum but 61.8% golden ratio probes bears.
- Convergence of 200-DMA, two-month-old resistance line and 50% Fibonacci retracement level restricts short-term upside.

WTI crude oil prices struggle to extend the latest rebound at around $90.00 during Tuesday’s initial Asian session.
The black gold began the week on a positive side while extending Friday’s recovery from the 61.8% Fibonacci retracement level of December 2021 to the March 2022 upside, near $86.90.
However, downbeat RSI and sluggish MACD seem to challenge the WTI crude oil’s further recovery, which in turn restricts the quote’s latest moves below $90.00.
It’s worth noting that the commodity’s further upside past the $90.00 immediate hurdle needs validation from the $94.30-50 resistance area comprising the 50-DMA, 50% Fibonacci retracement level and a downward sloping trend line from early July.
During the quote’s pullback, the 61.8% Fibonacci retracement level near $86.90 could restrict immediate downside ahead of the late January swing low around $81.70.
Should WTI price remain weak past $81.70, the $80.00 round figure and early December 2021 swing high around $73.70 should lure the oil bears.
WTI: Daily chart
Trend: Limited upside expected
Author

Anil Panchal
FXStreet
Anil Panchal has nearly 15 years of experience in tracking financial markets. With a keen interest in macroeconomics, Anil aptly tracks global news/updates and stays well-informed about the global financial moves and their implications.


