WTI Price Analysis: Charting a bull flag, a test of $80 on the cards
- WTI price regains poise after the profit-taking slide on Friday.
- Tightening supplies from Libya offers the much-needed impetus to oil bulls.
- WTI recaptures 50-DMA, with a potential bull flag formation on the daily sticks.

WTI (NYMEX futures) is posting 1% gains so far this Monday, kicking off the first trading day of 2022 on the front foot.
The European equities have opened firmer, adding to the market’s optimism, in turn, boosting the higher-yielding oil price. Meanwhile, tightening oil supplies from Libya also offers support to the renewed upside in the black gold.
At the time of writing, the US oil is battling the $76 mark, trading close to the daily highs of $76.11. WTI hit fresh five-week highs of $77.25 on Thursday before ending the year on Friday at $75.26.
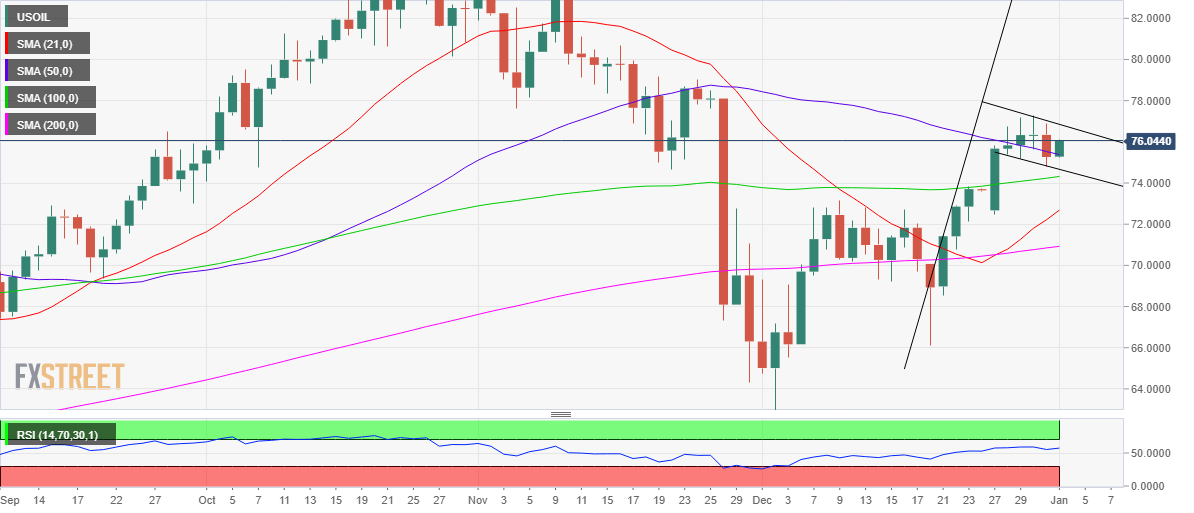
Technically, WTI is charting a bull flag formation on the daily sticks, in the wake of the recent consolidation that followed the rally from December 20 troughs.
A daily closing above the falling trendline resistance at $76.84 will validate a bull flag, opening doors for a rally towards the $80 mark.
Ahead of that target, bulls could face some strong resistance around November 26 highs of $78.10.
The 14-day Relative Strength Index (RSI) points higher above the midline, allowing room for more gains.
Oil buyers remain hopeful so long as WTI holds above the bearish 50-Daily Moving Average (DMA) at $75.83.
A sustained breach of the latter will expose the falling trendline support at $74.66. At that level, the horizontal 100-DMA aligns, making it a powerful hurdle.
WTI: Daily chart
WTI: Additional levels to watch
Author

Dhwani Mehta
FXStreet
Residing in Mumbai (India), Dhwani is a Senior Analyst and Manager of the Asian session at FXStreet. She has over 10 years of experience in analyzing and covering the global financial markets, with specialization in Forex and commodities markets.