|

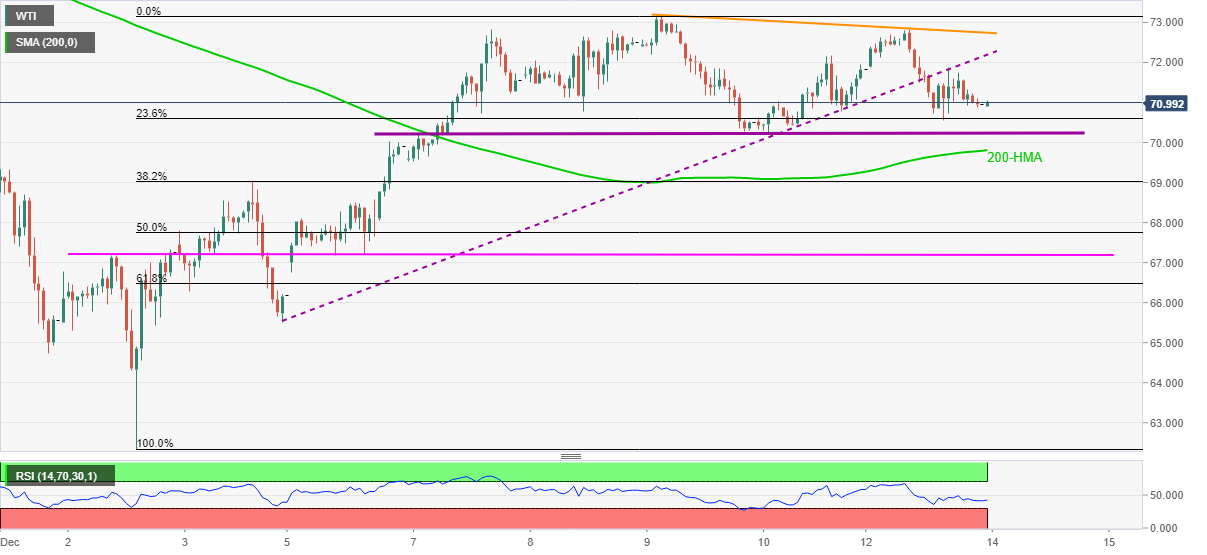
WTI Price Analysis: Bears take a breather on the way to $69.80

  • WTI consolidates recent losses after breaking short-term support.
  • Descending RSI, not oversold, adds to the bearish bias targeting 200-HMA.
  • Immediate descending trend line challenges buyer’s return ahead of $73.20.

WTI crude oil defends the $71.00 threshold during a quiet Asian session on Tuesday. Even so, the energy bears remain hopeful as the quote broke an upward sloping trend line from December 03 the previous day.

Adding to the bearish bias is the descending RSI line, not oversold, as well as a falling trend line from the last Thursday.

That said, a one-week-old horizontal support area around $70.20 may offer an intermediate halt to the oil sellers before directing them to the 200-HMA level of $69.80.

In a case where the black gold drops below $69.80, the 38.2% Fibonacci retracement (Fibo.) level of December 02-09 upside will precede an eight-day-long horizontal line, respectively around $69.00 and $67.20, to challenge the WTI’s further downside.

On the flip side, the previous support line and descending resistance line from December 12, around $72.20 and $72.80 in that order, restrict the short-term upside of the WTI crude oil prices.

Adding to the resistance is the monthly top near $73.20, a break of which will highlight the late November swing low near $74.65 for the bulls.

WTI: Hourly chart

Trend: Further weakness expected

Additional important level

Overview
Today last price71
Today Daily Change-0.82
Today Daily Change %-1.14%
Today daily open71.82
 
Trends
Daily SMA2072.97
Daily SMA5077.77
Daily SMA10073.77
Daily SMA20070.1
 
Levels
Previous Daily High72.18
Previous Daily Low70.2
Previous Weekly High73.17
Previous Weekly Low66.17
Previous Monthly High83.97
Previous Monthly Low64.32
Daily Fibonacci 38.2%71.43
Daily Fibonacci 61.8%70.96
Daily Pivot Point S170.62
Daily Pivot Point S269.42
Daily Pivot Point S368.64
Daily Pivot Point R172.6
Daily Pivot Point R273.39
Daily Pivot Point R374.59

Author

Anil Panchal

Anil Panchal

FXStreet

Anil Panchal has nearly 15 years of experience in tracking financial markets. With a keen interest in macroeconomics, Anil aptly tracks global news/updates and stays well-informed about the global financial moves and their implications.

More from Anil Panchal
Share:

Markets move fast. We move first.

Orange Juice Newsletter brings you expert driven insights - not headlines. Every day on your inbox.

By subscribing you agree to our Terms and conditions.

Editor's Picks

EUR/USD clings to gains above 1.1700

Following the correction seen in the second half of the previous week, EUR/USD gains traction to start the new week and trades in positive territory above 1.1700. The US Dollar (USD) struggles to attract buyers as investors await Tuesday's GDP data ahead of the Christmas holiday. 

GBP/USD rises above 1.3400 on renewed USD weakness

GBP/USD turns north on Monday and trades in positive territory above 1.3400. The US Dollar (USD) stays on the back foot to begin the new week as investors adjust their positions before tomorrow's growth data, helping the pair stretch higher.

Gold hits new record-high above $4,400 as geopolitical tensions escalate

Gold trades at a fresh all-time-high above $4,400 Monday, rising more than 1.5% on a daily basis. The potential for a re-escalation of the tensions in the Middle East on news of Israel planning to attack Iran allows Gold to capitalize on safe-haven flows.

Bitcoin, Ethereum and Ripple eye breakout for fresh recovery

Bitcoin, Ethereum, and Ripple are approaching key technical levels at the time of writing on Monday as the broader crypto market stabilizes. Market participants are closely watching whether BTC, ETH, and XRP can sustain breakouts and achieve decisive daily closes above nearby resistance levels, which could signal the start of a short-term recovery.

Ten questions that matter going into 2026

2026 may be less about a neat “base case” and more about a regime shift—the market can reprice what matters most (growth, inflation, fiscal, geopolitics, concentration). The biggest trap is false comfort: the same trades can look defensive… right up until they become crowded.

Hyperliquid price forecast: Bullish interest builds amid user recovery

Hyperliquid (HYPE) trades at $25 at press time on Monday, holding the 3% gains from the previous day. The perpetual exchange sees a recovery in active users, while weekly fees collected decline to the lowest level so far this month.