|

WTI Price Analysis: Battles with 21-HMA on the road to recovery

  • WTI struggles to close the bearish opening gap. 
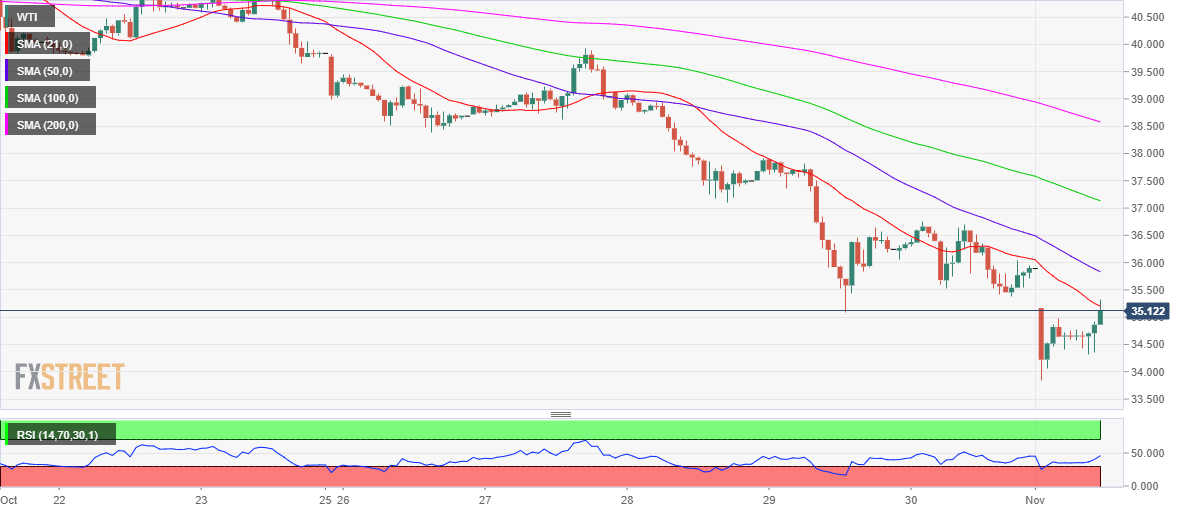
  • A firm break above 21-HMA is critical for the bulls.
  • US oil remains vulnerable amid demand concerns, election woes.

WTI (futures on NYMEX) is attempting a tepid recovery from five-month lows of $33.85 reached in early Asia, as the bulls were rescued by the upbeat Chinese Caixin Manufacturing PMI and a rebound in Japanese exports orders.

Despite the bounce, the risks remain skewed to the downside for the black gold, as the coronavirus fears deepen, with the UK and key European economies under fresh lockdowns, stoking oil demand concerns.

Meanwhile, investors scurry up to the safe-haven US dollar ahead of Tuesday’s election, exerting additional downward pressure on the USD-denominated oil.

The oil bulls are trying hard to close the bearish opening gap, as the prices waver around $35 mark, unable to stage a sustained recovery through the downward-sloping 21-hourly moving average of $35.20.

Acceptance above the latter could expose the bearish 50-HMA at 35.83. Buyers need a daily closing above $35.90 to sustain the recovery momentum.

Alternatively, the five-month lows could be put to risk if the sentiment on Wall Street turns sour. Although that look unlikely, indicated by the 1.15% rally in S&P 500 futures, at the moment.

WTI hourly chart

WTI additional levels

WTI

Overview
Today last price35.04
Today Daily Change-0.86
Today Daily Change %-2.40
Today daily open35.9
 
Trends
Daily SMA2039.8
Daily SMA5040.09
Daily SMA10040.45
Daily SMA20037.87
 
Levels
Previous Daily High36.75
Previous Daily Low35.38
Previous Weekly High39.93
Previous Weekly Low35.08
Previous Monthly High41.93
Previous Monthly Low35.08
Daily Fibonacci 38.2%35.9
Daily Fibonacci 61.8%36.23
Daily Pivot Point S135.27
Daily Pivot Point S234.64
Daily Pivot Point S333.9
Daily Pivot Point R136.64
Daily Pivot Point R237.38
Daily Pivot Point R338.01

Author

Dhwani Mehta

Dhwani Mehta

FXStreet

Residing in Mumbai (India), Dhwani is a Senior Analyst and Manager of the Asian session at FXStreet. She has over 10 years of experience in analyzing and covering the global financial markets, with specialization in Forex and commodities markets.

More from Dhwani Mehta
Share:

Editor's Picks

AUD/USD eyes 0.7150 barrier nine-day EMA

AUD/USD inches higher after registering modest losses in the previous day, trading around 0.7130 during the Asian hours. The technical analysis of the daily chart indicates that the pair is moving sideways within the rectangle pattern, suggesting a consolidation as neither the bulls nor the bears have enough momentum to take control of the market.

USD/JPY trades below 160.00 intervention threshold; bullish bias intact

The USD/JPY pair attracts some sellers during the Asian session amid fears that authorities will step in again to prop up the Japanese Yen. Furthermore, the Israel-Lebanon truce prompts some profit-taking around the US Dollar and exerts downward pressure on the currency pair.

Gold defends 200-day SMA at $4,425, but for how long?

Gold is attempting a tepid recovery toward $4,500 early Thursday, as renewed optimism in the Mideast geopolitical front calms market nerves. This cautious optimism across Asian markets weighs on Oil prices, and diminishes the US Dollar’s safe-haven appeal, helping Gold stage a decent comeback from the weekly low of $4,424.


Hyperliquid: ETF demand, capital rotation fuel HYPE rally as Bitcoin melts

Hyperliquid price sustains an upward trend near its all-time high of $75.76 on Thursday after posting 80% gains in May, while Bitcoin (BTC) retraces below $65,000, triggering a market-wide panic.

Kevin Warsh takes the Fed helm: What it means for the US Dollar
The Federal Reserve moves away from the highly predictable "forward guidance" model of the Jerome Powell era to a new “Kevin Warsh environment”, characterized by less communication, more policy surprises, and an increased focus on the Fed's complex balance sheet.
Recession on paper: What really moves the Canadian Loonie now?

Statistics Canada handed the headline writers a gift and the analysts a headache. Real GDP shrank 0.1% on an annualized basis in the first quarter, and with the fourth quarter of 2025 revised down to a 1.0% contraction, that is two negative quarters in a row, the textbook definition of a technical recession and Canada's first since the pandemic.