WTI Price Analysis: Advances to fresh 10-month high, overbought RSI warrants caution for bulls
- WTI Crude Oil prices extend the upward trajectory and climb to a fresh YTD peak on Wednesday.
- The technical setup favours bullish traders and supports prospects for a further appreciating move.
- The RSI on the daily chart is already flashing overbought conditions and warrants some caution.

Western Texas Intermediate (WTI) Crude Oil prices prolong a three-week-old uptrend and touch a fresh 10-month peak, around the $89.00 mark during the early part of the European session on Wednesday.
The Organization of Petroleum Exporting Countries (OPEC), in its monthly report released on Tuesday, said that Oil markets will tighten further this year amid robust demand and lower production. This comes on top of deeper supply cuts announced by Saudi Arabia and Russia – the world's two biggest Oil producers – for the remainder of 2023 and continues to benefit the black liquid.
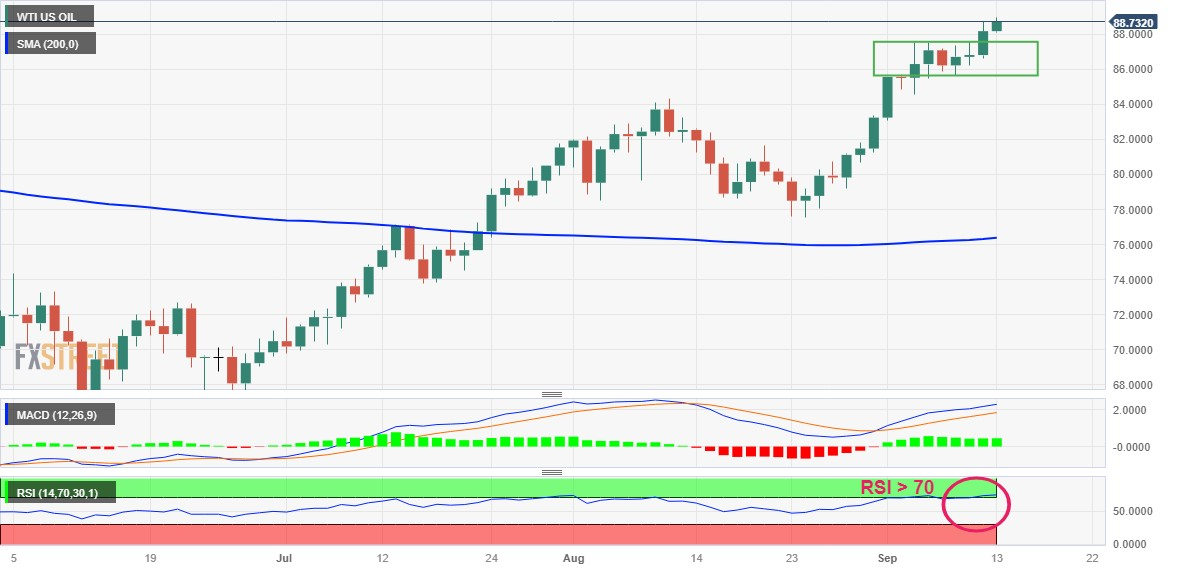
From a technical perspective, the overnight strong move-up confirmed a breakout through the top end of a multi-day-old trading range and supports prospects for a further near-term appreciating move. That said, the Relative Strength Index (RSI) on the daily chart is already flashing overbought conditions. This, in turn, warrants some caution before placing fresh bullish bets around the commodity.
Hence, it will be prudent to wait for some near-term consolidation or a modest pullback before the next leg up. Any meaningful corrective decline, meanwhile, is likely to attract fresh buyers near the $88.00 mark. This should help limit the downside for WTI Crude Oil prices near the aforementioned trading range resistance breakpoint, now turned support, around the $87.55-$87.45 region.
The next relevant support is pegged near the $87.00 round figure, which if broken decisively has the potential to drag the black liquid towards the $86.30-$86.20 intermediate support en route to the $86.00 mark. The downfall could get extended further towards the next relevant support near the $85.60-$85.50 area, which should act as a strong near-term base for WTI Crude Oil prices.
On the flip side, a sustained strength above the $89.00 level should pave the way for a move beyond the $89.30-$89.35 zone, towards reclaiming the $90.00 psychological mark. Some follow-through buying will set the stage for additional gains and allow Crude Oil prices to climb further towards the $91.00 round figure en route to the $91.70-$91.80 supply zone and the $92.00 mark.
WTI Crude Oil daily chart
Technical levels to watch
Author

Haresh Menghani
FXStreet
Haresh Menghani is a detail-oriented professional with 10+ years of extensive experience in analysing the global financial markets.
















