WTI hits three-month low as OPEC+ meeting looms
- WTI falls to $61.20, its lowest level since June 2, before stabilizing near $61.50.
- Markets brace for Sunday’s OPEC+ meeting, with Saudi Arabia pushing for an accelerated return of 1.66 mb/d supply, though no final decision has been made.
- WTI trades below the 50-day SMA at $64.90, with key support at $61.50; a break lower could target $59.50-58.50.

West Texas Intermediate (WTI) Crude Oil is heading into the weekend under heavy pressure, extending its losing streak to a third straight day as traders brace for the Organization of the Petroleum Exporting Countries and allies (OPEC+) meeting on Sunday, September 7. At the time of writing, WTI is trading near $61.50 per barrel, down about 2.70% on the day, marking its lowest level since June 2 and leaving the US benchmark on course for its first weekly decline in three weeks.
The latest sell-off comes as investors weigh the prospect of a supply shift from the OPEC+. According to a Bloomberg report, Saudi Arabia has been pressing the group to accelerate the return of roughly 1.66 million barrels per day of previously curtailed supply, in a bid to reclaim global market share. While delegates stressed that no final decision has been made and keeping output steady into October remains an option, sources noted an increase could be agreed as soon as this weekend or later in the year. Any proposal to boost output may also face resistance from members keen to keep prices elevated.
The bearish tone has been reinforced by a surprise build in US crude inventories this week, which added to oversupply concerns. Energy equities have also tracked Oil lower, underscoring investor unease as the potential for an early OPEC+ supply boost coincides with signs of softer demand.
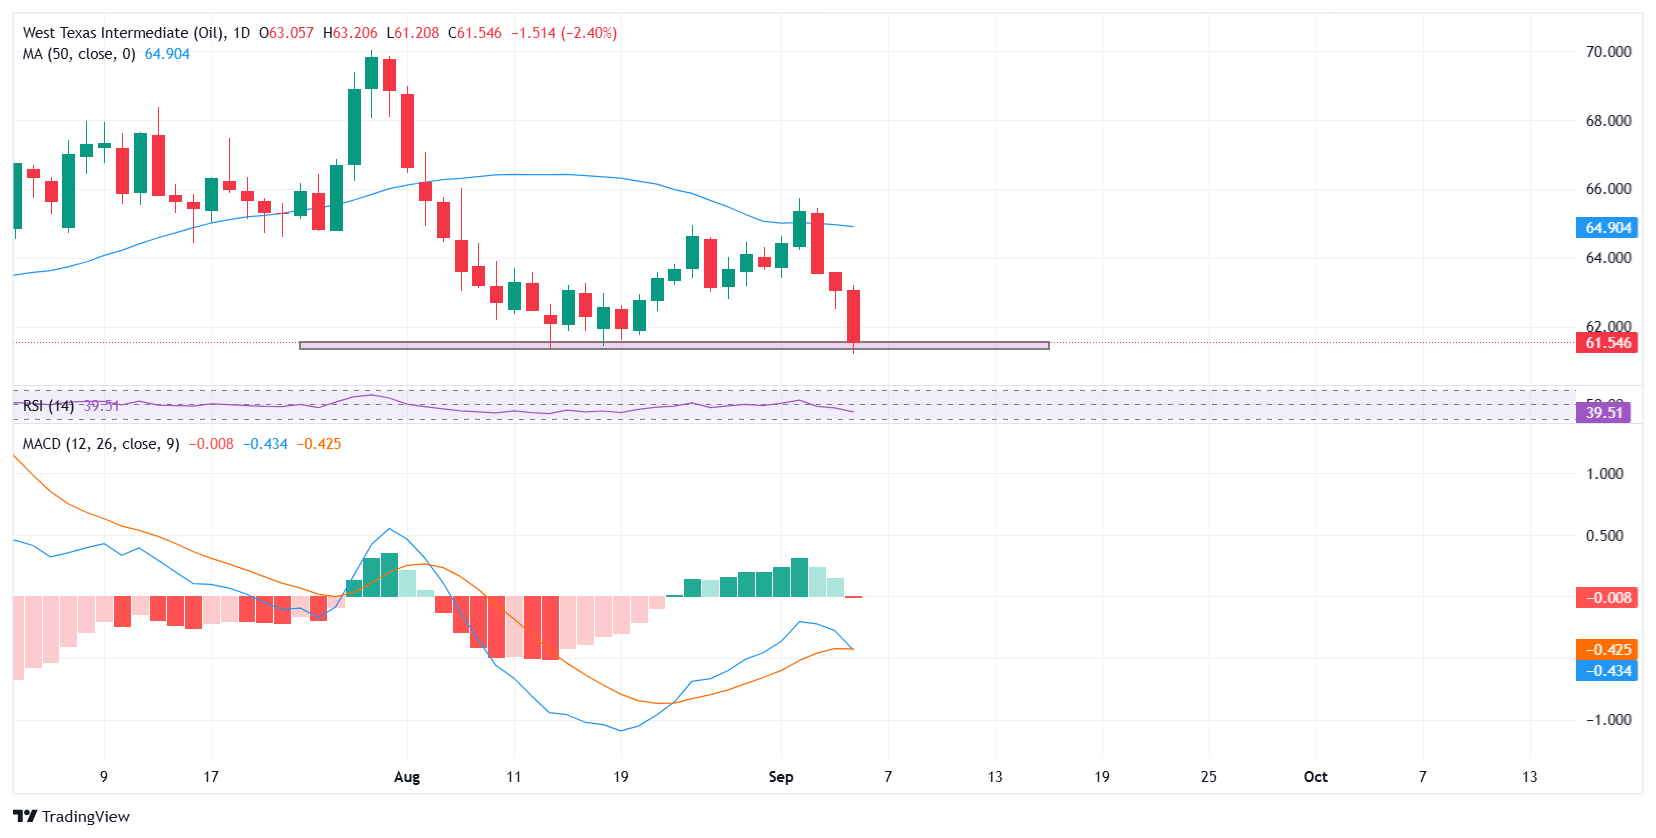
WTI remains pinned below the 50-day Simple Moving Average (SMA) at $64.90 after a clean rejection earlier this week, keeping the short-term trend bearish. Prices are holding just above a key support zone at $61.50, an area that has repeatedly stopped declines in August. If this floor breaks on a daily or weekly close, the next downside levels sit near $59.50 and $58.50, with risks extending into the $57.00s. On the upside, any bounce would first need to clear $62.50-63.50, with stronger resistance seen at the 50-day SMA. Until those levels are reclaimed, rallies are likely to face selling pressure.
The Relative Strength Index (RSI) is hovering near 39, pointing to persistent bearish momentum but not yet oversold. This suggests there may still be room for additional downside before buyers step in, though the proximity to a long-held support zone raises the risk of a potential rebound if prices manage to stabilize above $61.00.
WTI Oil FAQs
WTI Oil is a type of Crude Oil sold on international markets. The WTI stands for West Texas Intermediate, one of three major types including Brent and Dubai Crude. WTI is also referred to as “light” and “sweet” because of its relatively low gravity and sulfur content respectively. It is considered a high quality Oil that is easily refined. It is sourced in the United States and distributed via the Cushing hub, which is considered “The Pipeline Crossroads of the World”. It is a benchmark for the Oil market and WTI price is frequently quoted in the media.
Like all assets, supply and demand are the key drivers of WTI Oil price. As such, global growth can be a driver of increased demand and vice versa for weak global growth. Political instability, wars, and sanctions can disrupt supply and impact prices. The decisions of OPEC, a group of major Oil-producing countries, is another key driver of price. The value of the US Dollar influences the price of WTI Crude Oil, since Oil is predominantly traded in US Dollars, thus a weaker US Dollar can make Oil more affordable and vice versa.
The weekly Oil inventory reports published by the American Petroleum Institute (API) and the Energy Information Agency (EIA) impact the price of WTI Oil. Changes in inventories reflect fluctuating supply and demand. If the data shows a drop in inventories it can indicate increased demand, pushing up Oil price. Higher inventories can reflect increased supply, pushing down prices. API’s report is published every Tuesday and EIA’s the day after. Their results are usually similar, falling within 1% of each other 75% of the time. The EIA data is considered more reliable, since it is a government agency.
OPEC (Organization of the Petroleum Exporting Countries) is a group of 12 Oil-producing nations who collectively decide production quotas for member countries at twice-yearly meetings. Their decisions often impact WTI Oil prices. When OPEC decides to lower quotas, it can tighten supply, pushing up Oil prices. When OPEC increases production, it has the opposite effect. OPEC+ refers to an expanded group that includes ten extra non-OPEC members, the most notable of which is Russia.
Author

Vishal Chaturvedi
FXStreet
I am a macro-focused research analyst with over four years of experience covering forex and commodities market. I enjoy breaking down complex economic trends and turning them into clear, actionable insights that help traders stay ahead of the curve.


