|

WTI faces headwinds as Russia lifts ban amid strong US Dollar on Fed’s hawkish hold

  • WTI crude oil trades with over 0.50% losses after hitting a high of $90.34.
  • Federal Reserve's decision to hold rates but project higher rates for the next year has snapped WTI’s three-week rally.
  • Oil prices were cushioned by a drop in oil rigs count in the US, along with China’s economic recovery accelerating.

West Texas Intermediate (WTI), the US crude oil benchmark, traded with more than 0.50% losses on Monday as Russia tweaked its fuel ban. At the same time, higher interest rates in the United States (US) boosted the Greenback (USD), a headwind for US dollar-denominated assets. WTI is trading at $89.35 per barrel, late in the North American session.

West Texas Intermediate dips on Russia’s relaxing fuel ban, strong USD

Investors' mood remains downbeat as speculations the US central bank would increase rates one more time. According to some banks on Wall Street, Russia’s approval of changes to its fuel export ban was a headwind to oil prices, which were set to hit $100 per barrel.

Last week’s Fed decision to hold rates but upward revise the dot-plots for the next year, foreseeing rates above 5%, snapped oil’s three-week rally that witnessed WTI gaining more than 10%, as Saudi Arabia and Russia extended its crude oil output cuts toward December 2023.

The Fed sent US bond yields skyrocketing, underpinning the Greenback to a year-to-date high of 106.09, as drafted by the US Dollar Index (DXY). Nevertheless, WTI’s fall was cushioned by the oil rig's count falling last week to 507 from 515, despite higher oil prices.

In the meantime, speculations of better economic data from China keep oil traders’ spirits higher, following last week’s data. China is the world’s largest oil importer, and if economic activity slows down, it could weigh on global oil prices.

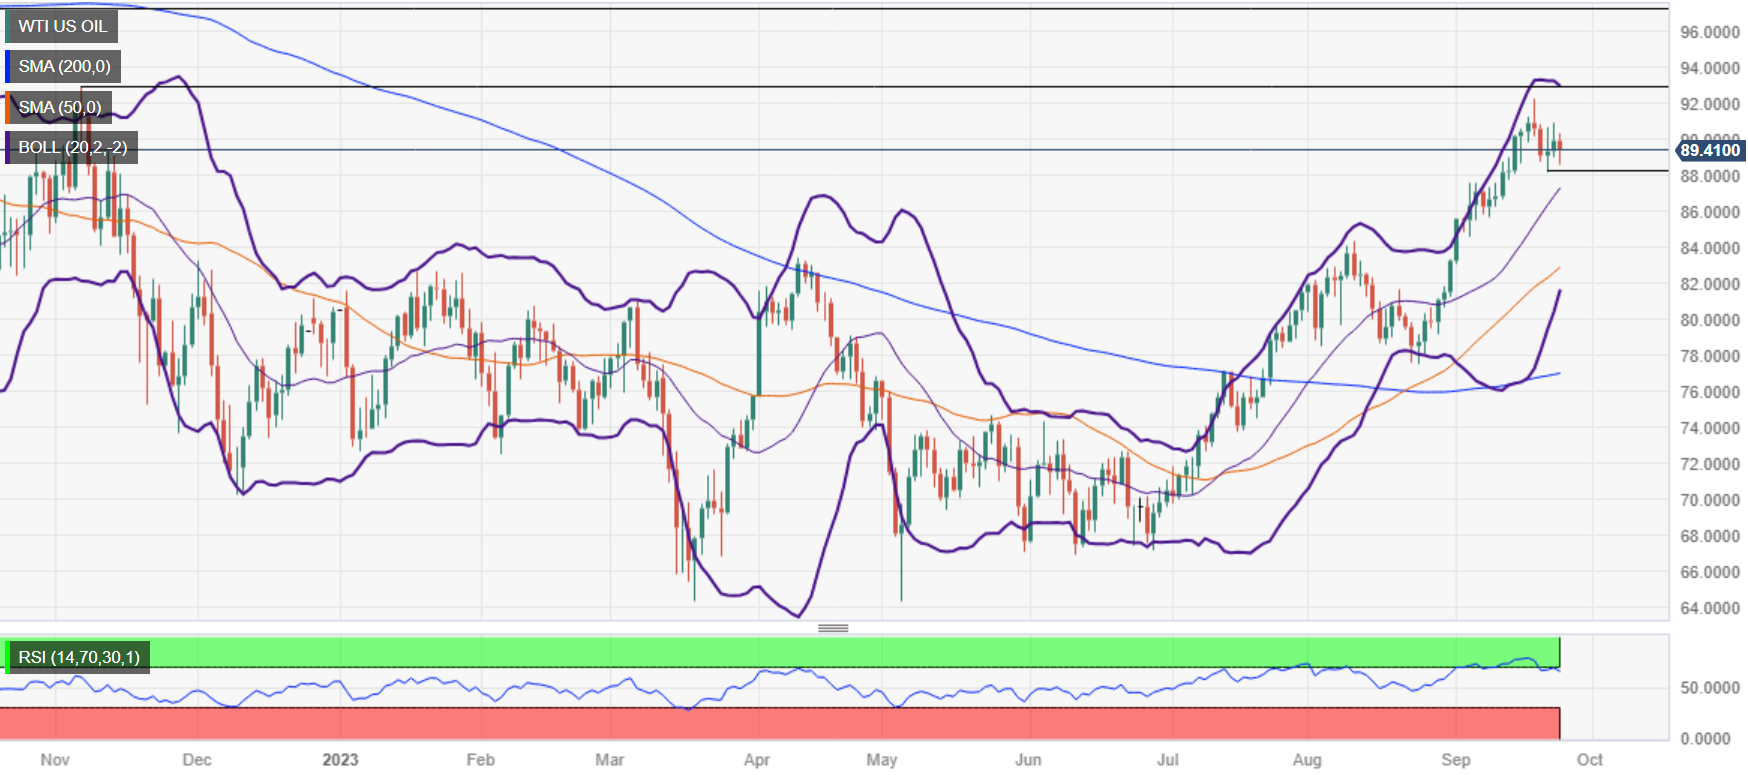
WTI Price Analysis: Technical outlook

WTI remains upward biased but fails to pierce the top-Bollinger band, while the Relative Strength Index (RSI) exits from overbought conditions, opening the door for a pullback. Support is seen at the September 21 daily low of $88.15 before the US crude oil price tests the 20-day Exponential Moving Average (DMA) at $87.31. Contrarily, WTI would resume its uptrend but must clear last Friday's high at $90.93 before challenging the year-to-date (YTD) high at $92.26.

WTI US OIL

Overview
Today last price89.29
Today Daily Change-0.66
Today Daily Change %-0.73
Today daily open89.95
 
Trends
Daily SMA2086.84
Daily SMA5082.6
Daily SMA10077.07
Daily SMA20076.94
 
Levels
Previous Daily High90.94
Previous Daily Low88.98
Previous Weekly High92.26
Previous Weekly Low88.15
Previous Monthly High84.32
Previous Monthly Low77.53
Daily Fibonacci 38.2%90.19
Daily Fibonacci 61.8%89.73
Daily Pivot Point S188.97
Daily Pivot Point S288
Daily Pivot Point S387.01
Daily Pivot Point R190.93
Daily Pivot Point R291.91
Daily Pivot Point R392.89

Author

Christian Borjon Valencia

Christian Borjon began his career as a retail trader in 2010, mainly focused on technical analysis and strategies around it. He started as a swing trader, as he used to work in another industry unrelated to the financial markets.

More from Christian Borjon Valencia
Share:

Markets move fast. We move first.

Orange Juice Newsletter brings you expert driven insights - not headlines. Every day on your inbox.

By subscribing you agree to our Terms and conditions.

Editor's Picks

EUR/USD bounces toward 1.1750 as US Dollar loses strength

EUR/USD returned to the 1.1750 price zone in the American session on Friday, despite falling Wall Street, which indicates risk aversion. Trading conditions remain thin following the New Year holiday and ahead of the weekend, with the focus shifting to US employment and European data scheduled for next week.

GBP/USD nears 1.3500, holds within familiar levels

After testing 1.3400 on the last day of 2025, GBP/USD managed to stage a rebound. Nevertheless, the pair finds it difficult to gather momentum and trades with modest intraday gains at around 1.3490 as market participants remain in holiday mood.

Gold trims intraday gains, approaches $4,300

Gold retreated sharply from the $4,400  area and trades flat for the day in the $4,320 price zone. Choppy trading conditions exacerbated the intraday decline, although XAU/USD bearish case is out of the picture, considering growing expectations for a dovish Fed and persistent geopolitical tensions.

Cardano gains early New Year momentum, bulls target falling wedge breakout

Cardano kicks off the New Year on a positive note and is extending gains, trading above $0.36 at the time of writing on Friday. Improving on-chain and derivatives data point to growing bullish interest, while the technical outlook keeps an upside breakout in focus.

Economic outlook 2026-2027 in advanced countries: Solidity test

After a year marked by global economic resilience and ending on a note of optimism, 2026 looks promising and could be a year of solid economic performance. In our baseline scenario, we expect most of the supportive factors at work in 2025 to continue to play a role in 2026.

Crypto market outlook for 2026

Year 2025 was volatile, as crypto often is.  Among positive catalysts were favourable regulatory changes in the U.S., rise of Digital Asset Treasuries (DAT), adoption of AI and tokenization of Real-World-Assets (RWA).