WTI erases its Monday’s gains, back below $77.00
- Speculations for further tightening by the Federal Reserve underpin the US Dollar, a headwind for oil prices.
- China’s reopening and Russia expected to cut its oil production capped WTI’s fall.
- WTI Technical analysis: Neutral to downward biased; once it breaks $75.00, a retest of monthly lows is likely.

Western Texas Intermediate (WTI), the US crude oil benchmark, is erasing Monday’s gains which fell shy of reaching the 20-day Exponential Moving Average (EMA), and dropped towards the lows of the week around 75.97 before settling around the current price. At the time of typing, WTI is losing 0.94%, trading at 76.64 per barrel.
Oil prices affected by a strong US Dollar
The strong US Dollar (USD) narrative is hitting the commodities market. During the last week, Federal Reserve (Fed) officials continued their hawkish rhetoric while data supported some of their comments. Traders should remember that although Cleveland and St. Louis Fed Presidents Loretta Mester and James Bullard do not vote in the FOMC, both supported raising rates by 50 bps.
That spurred speculations that the US Federal Reserve (Fed) might hike rates not twice but three times, which could lift the Federal Funds Rate (FFR) to the 5.25%-5.50% mark.
Meanwhile, the US Dollar Index (DXY), which tracks the buck’s value vs. a basket of six currencies, advances 0.29%, up at 104.184, a headwind for dollar-denominated assets. Therefore, a strong USD makes oil prices expensive for foreign countries.
Aside from this, China’s reopening is a factor playing into WTI’s price, and capped oil prices fall in Tuesday’s session. Russia’s announced that it plans to cut production by 500,000 bpd or about 5% of its output in March as retaliation to the West imposing price caps on Russian oil and oil-related products.
Data-wise, US oil inventories and data, which were to be released on Tuesday, was postponed in observance of President’s Day and moved to Wednesday and Thursday.
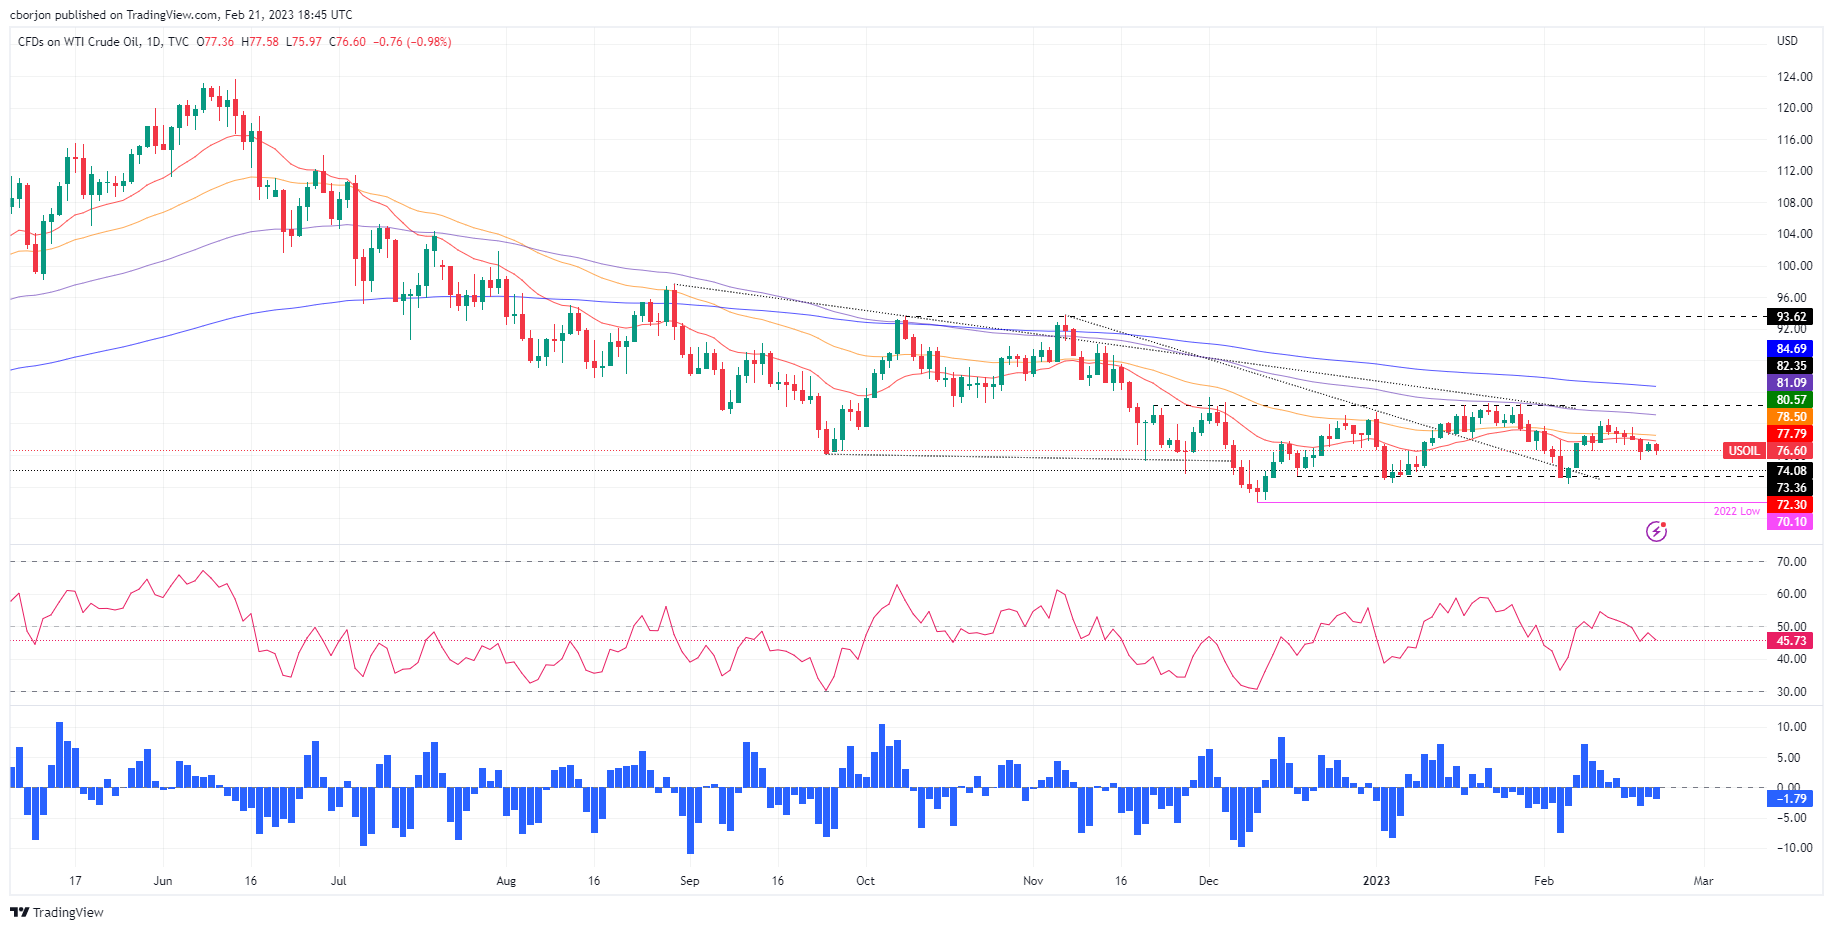
WTI Technical analysis
From a technical perspective, WTI is still neutral to downward biased, capped by all the Exponential Moving Averages (EMAs) resting above oil’s price. In addition, the Relative Strength Index (RSI) is in bearish territory and is aiming downwards. The Rate of Change (RoC), albeit steadily, shows that sellers continue gaining momentum.
Hence, WTI’s first support would be $75.97. Once cleared, the oil price would tumble to the last week’s low at $75.36, followed by the MTD low at $72.30.
Author

Christian Borjon Valencia
FXStreet
Markets analyst, news editor, and trading instructor with over 14 years of experience across FX, commodities, US equity indices, and global macro markets.


