|

WTI crude oil prices surge on supply cuts, weaker USD ahead of US inflation report

  • Saudi Arabia and Russia reduce oil output by 1.5 million barrels.
  • WTI prices rise, buoyed by a weaker US Dollar.
  • IEA predicts a tight oil market through H2 2023 due to demand and supply factors.

Western Texas Intermediate (WTI), the US crude oil benchmark, advances sharply more than 1.70% or $1.30 per barrel on Tuesday, spurred by supply cuts established by Saudi Arabia and Russia, while China’s woes about a global economic slowdown, cushions WTI’s rise. At the time of writing, WTI is trading at $74.50 after hitting a daily low of $73.03.

China’s dampened demand and Saudi-Russia output cut boosted Oil prices

During the North American session, the 1.5 million barrel crude oil output cut by Saudia Arabia and Russia is one of the main reasons for Oil’s jump. That, alongside a weaker US Dollar (USD), amid a light economic calendar in the United States (US), is lifting WTI prices across the board.

However, Oil traders must be aware that on Wednesday, a hot June Consumer Price Index (CPI) report in the US could suggest that further tightening is needed to curb stickier inflation, which could pave the way for more US Federal Reserve (Fed) rate increases. Consequently, that can underpin US Treasury bond yields and the US Dollar, refraining WTI traders from opening fresh bets on the oil price rise.

Meanwhile, the International Energy Agency (IEA) stands firm that oil demand from China and developed countries, mixed with the latest supply cuts, would keep the Oil market tight during the second half of 2023.

According to Reuters, sources told that “top buyer China again requested less supply from the world’s biggest oil exporter, Saudi Aramco.”

WTI Price Analysis: Technical outlook

WTI Daily chart

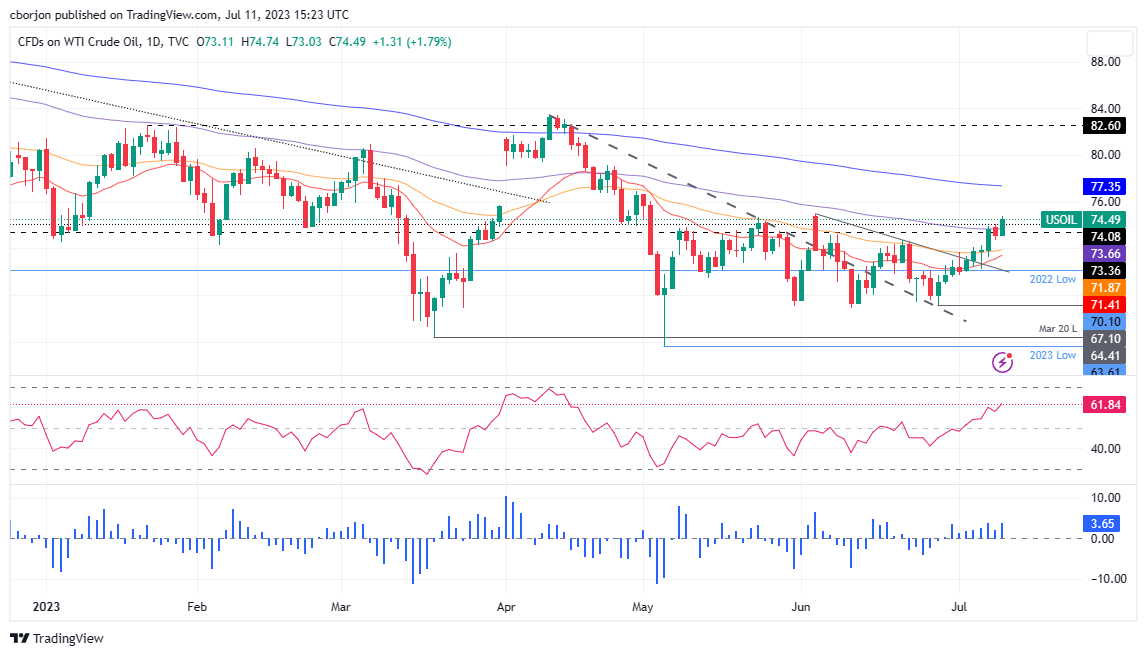
From a technical perspective, WTI buyers reclaiming the 100-day Exponential Moving Average (EMA) at $73.06 has established a floor in the near term. Still, WTI prices remain capped by the June 5 daily high of $74.92; if surpassed, that could pave the way to the psychological $76.00 figure before testing the 200-day EMA at $77.35. Conversely, if WTI does not deliver a daily close above the 100-day EMA, that could expose WTI to a fall below $73.00 and extend its losses toward the 50-day EMA at $71.87.

WTI US OIL

Overview
Today last price74.69
Today Daily Change1.53
Today Daily Change %2.09
Today daily open73.16
 
Trends
Daily SMA2070.68
Daily SMA5071.08
Daily SMA10073.59
Daily SMA20077.21
 
Levels
Previous Daily High74.08
Previous Daily Low72.67
Previous Weekly High73.85
Previous Weekly Low69.77
Previous Monthly High74.36
Previous Monthly Low66.95
Daily Fibonacci 38.2%73.21
Daily Fibonacci 61.8%73.54
Daily Pivot Point S172.52
Daily Pivot Point S271.89
Daily Pivot Point S371.12
Daily Pivot Point R173.93
Daily Pivot Point R274.71
Daily Pivot Point R375.34

Author

Christian Borjon Valencia

Christian Borjon began his career as a retail trader in 2010, mainly focused on technical analysis and strategies around it. He started as a swing trader, as he used to work in another industry unrelated to the financial markets.

More from Christian Borjon Valencia
Share:

Markets move fast. We move first.

Orange Juice Newsletter brings you expert driven insights - not headlines. Every day on your inbox.

By subscribing you agree to our Terms and conditions.

Editor's Picks

EUR/USD extends slide below 1.1700

The EUR/USD pair nears its weekly low at around 1.1660 in the American session on Tuesday, retreating from the 1.1750 price zone tested earlier in the day. Cautiously optimistic markets support the US Dollar in the near term.

GBP/USD retreats from three-month-high, pierces 1.3500

GBP/USD extends its intraday slide and trades in the red just below 1.3500 after setting a new three-month-high near 1.3570. Ahead of this week's key employment data releases from the US, markets recover the good mood.

Gold extends its advance aims to recover hte $4,500 mark

Gold eases from the weekly high it set at $4,475 but clings to modest gains above $4,450 in the second half of the day on Tuesday. While a rebound in the US Dollar caps the yellow metal's upside, heightened political tensions allow XAU/USD to keep its footing.

Australia CPI likely to test RBA hawkishness

The Australian Bureau of Statistics will publish the Consumer Price Index data for November at 00:30 GMT on Wednesday. This is the second complete monthly CPI report, as the government continues to transition from the quarterly CPI to the monthly gauge as the primary measure of headline inflation.

Implications of US intervention in Venezuela

Events in Venezuela are top of mind for market participants, and while developments are associated with an elevated degree of uncertainty, we are not making any changes to our markets or economic forecasts as a result of the deposition of Nicolás Maduro. 

Cardano holds steady as bulls intensify push for breakout

Cardano rises above the 50-day EMA resistance amid a risk-on mood across the crypto market. The MACD upholds positive divergence, increasing the potential for a 20% breakout to $0.505.