WTI corrects below the $60-mark, upside bias still intact
- WTI returns to the red after the two-day rally to 13-month tops.
- Potential bull flag on the 4H chart to challenge the corrective pullback.
- 21-SMA is the level to beat for the WTI sellers.

WTI (futures on NYMEX) extends its retreat from 13-month tops reached just below the $61 mark on Monday, as markets await the US weekly supply reports for the next direction in prices.
Despite the retracement, the black gold continues to draw support from escalating Middle-East tensions, covid vaccine-driven economic optimism and broad-based US dollar weakness.
The latest pullback can be associated with the closure of the US refineries due to the deep freeze.
WTI: Technical outlook
Looking at the four-chart, the recent rally that followed the consolidation has carved a bull flag formation, with a confirmation waited for the next leg higher in the US oil.
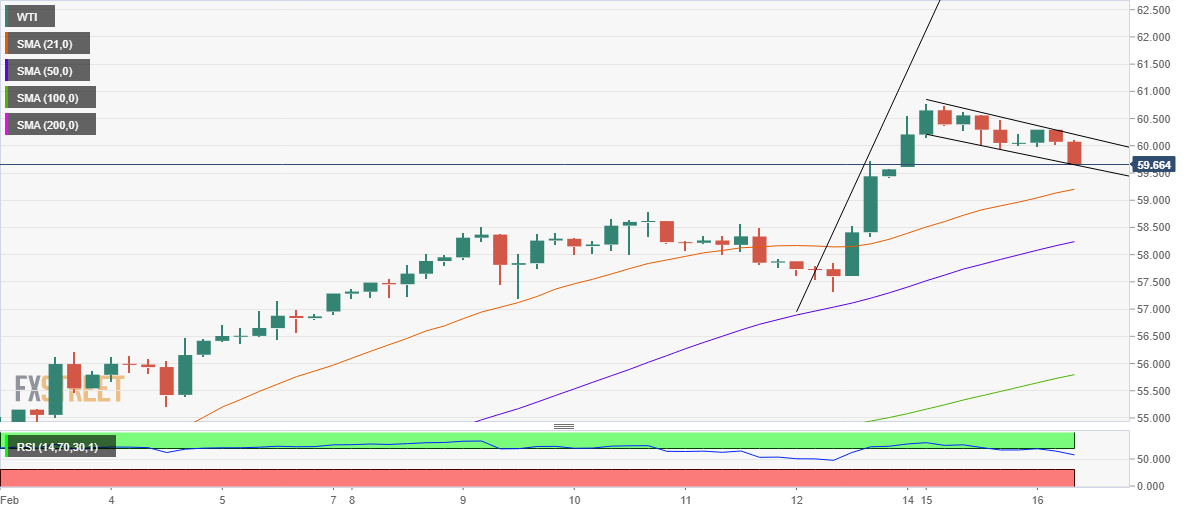
WTI: Four-hour chart
Therefore, a sustained break above the falling trendline resistance at $60.21 could yield the upside break, opening doors for a test of the multi-month highs at $60.76, above which the $61 mark could be challenged.
To the downside, the bullish 21-simple moving average (SMA) at $59.20 is likely to protect the buyers if the corrective decline picks up pace.
Acceptance under the falling trendline support at $59.65 could invalidate the bullish pattern, although that doesn’t seem likely so far, as the Relative Strength Index (RSI), currently trades at 58.39, suggests that the positive momentum still remains in place.
WTI additional levels
Author

Dhwani Mehta
FXStreet
Residing in Mumbai (India), Dhwani is a Senior Analyst and Manager of the Asian session at FXStreet. She has over 10 years of experience in analyzing and covering the global financial markets, with specialization in Forex and commodities markets.


