Will tomorrow’s CPI report crash the stock market?

In our previous update, we asked if NVIDIA Corporation’s (NVDA) earnings would crash the stock market, in this case, the NASDAQ100( NDX), and found.
“… NVDA’s earnings can swing the needle to lower prices temporarily, but contingent on the indexes holding above the September 6 lows, we must still expect higher prices after that.”
Indeed, NVDA’s earnings did not crash the stock market, as it never closed below the outlined NAS18,650 level. Instead, it broke above NDX21200 and could, therefore, reach as high as NDX21626 on December 6, following the Ending Diagonal (ED) path we outlined back then:
“The most obvious observation from the chart is that the rally since [August] has not completed five larger (red) waves up, let alone reached the 123.60% extension, which is a typical, minimal upside target for a 3rd wave (red W-iii) in an ED. Thus, we can allow another (grey) a-b-c pattern up from the October 31st low. This means the “Trump Trade” high was grey W-a, the most recent low was grey W-b, and grey W-c; ideally, $21,500 is about to commence. A break above $21,200 will help confirm this thesis.”
Figure 1. NDX daily chart with detailed Elliott Wave count and technical indicators
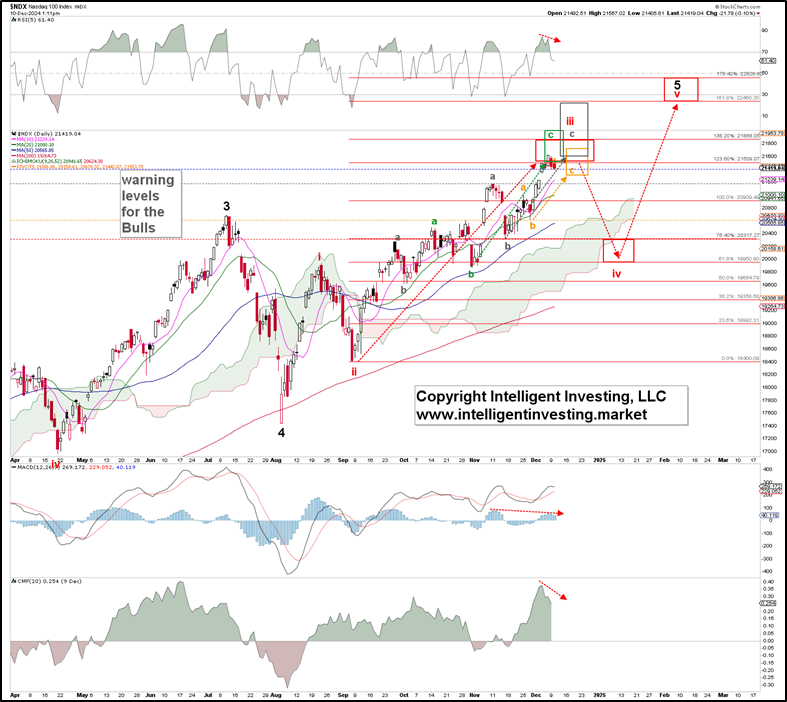
Thus, using the current data, we find that the index has completed the minimal number of waves required to consider the red W-iii complete. Red W-iii subdivided into three green waves (abc), with the later W-c further subdividing into three grey waves (abc). Moreover, the grey W-c subdivided into an additional (orange) W-a, b, and c pattern. Welcome to the infamous ED!
The ideal Fibonacci-based target zones for each wave degree (red, green, grey, and orange) are shown on the chart, and we can see that the index has reached all of them. So far, so good. But, as the index increased, we raised our warning levels accordingly to keep our premium members on the right side of the trade for as long as possible, and it has yet to break below the first (blue) warning level to give us a first indication that the red W-iii has topped. Thus, if the index can stay above it, with a 2nd more critical warning below the (grey) NDX21200 level, we can still allow it to reach the red 138.20% extension at $21868.
The bottom line is that the index has advanced to the minimal upside target for the third wave extension within an ending diagonal pattern. However, while the downside risk is thus currently increasing and appropriate actions should be taken, e.g., raise stops and take partial profits, until we see at least a break below NDX21200, we can still allow for higher prices. A break below that level, especially the (orange) 3rd warning level at NDX20600, will tell us that the red W-iv to ideally NDX20000-20300 is underway. From there, the red W-v can then target, ideally, $22460-22825. In the end, we’re still missing a more significant 4th and 5th wave (red W-iv and -v) from the infamous August low, and thus, tomorrow’s CPI report will not crash the markets. At best, it can start a decent correction.
Author

Dr. Arnout Ter Schure
Intelligent Investing, LLC
After having worked for over ten years within the field of energy and the environment, Dr.


