When is US ISM Manufacturing PMI data for April and how could it affect EUR/USD?

US ISM Manufacturing PMI Overview
The United States (US) Institute of Supply Management (ISM) Manufacturing Purchasing Managers’ Index (PMI) data for April is scheduled to be published today at 14:00 GMT.
According to estimates, the ISM is expected to report that the manufacturing activity expanded at a faster pace. The Manufacturing PMI is seen higher at 53.0 from 52.7 in March.
Theoretically, better-than-projected US ISM Manufacturing PMI data prompt expectations for interest rate hikes by the Federal Reserve (Fed) in the near term. On the contrary, soft figures diminish hawkish Fed prospects. However, weak figures are unlikely to weigh on hawkish Fed bets, as the recent commentary from Fed Chair Jerome Powell indicates that the central bank is more concerned about rising inflationary pressures.
Apart from the Manufacturing PMI, investors will also focus on sub-components of data, such as Employment Index, Prices Paid, and New Orders Index. ISM Manufacturing Prices Paid – which reflects changes in expenditure for inputs such as labor and raw material – is estimated higher at 80.0 from the previous reading of 78.3. This appears to be the consequence of elevated energy prices in the wake of the prolonged closure of the Strait of Hormuz. The ISM Employment Index is seen arriving at 49.0, higher than 48.7 in April.
How could US ISM Manufacturing PMI affect the EUR/USD?
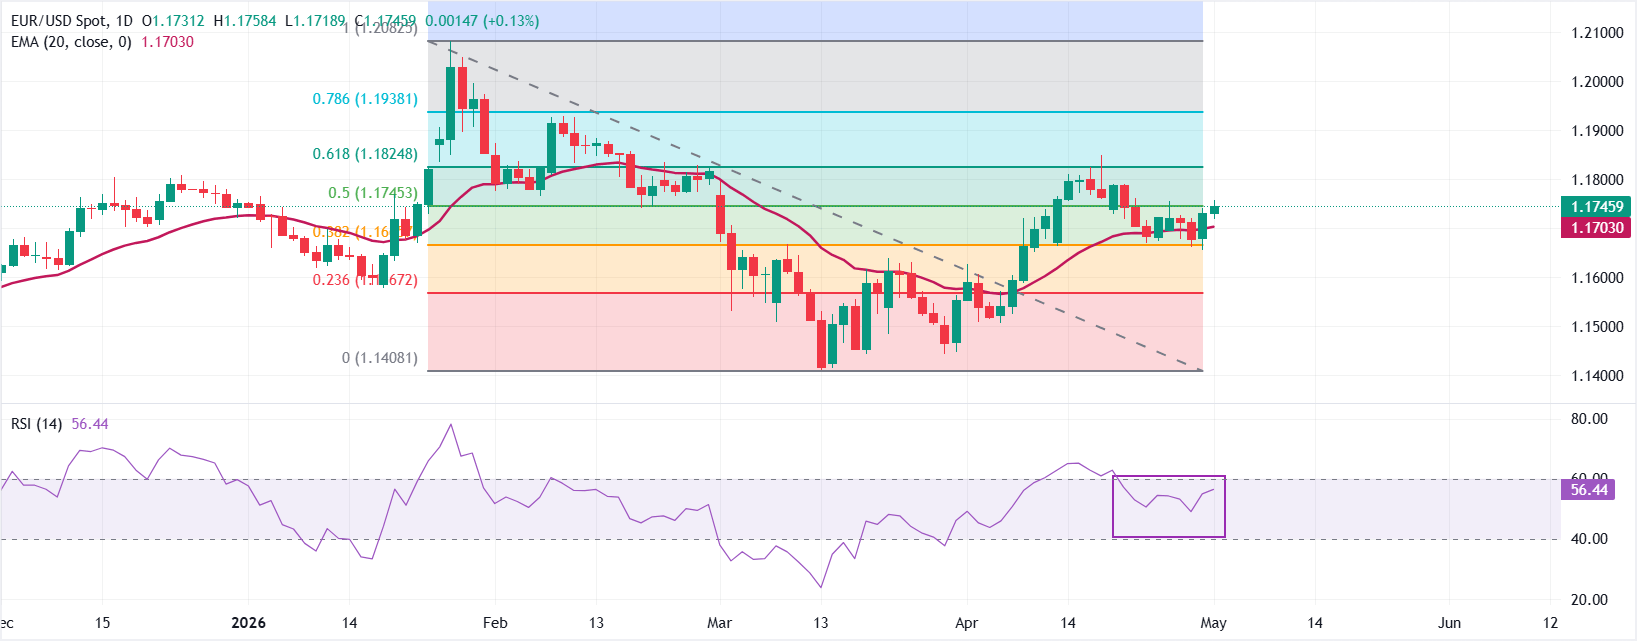
EUR/USD trades 0.17% higher at around 1.1750 ahead of the US ISM Manufacturing PMI data release, close to the 50% Fibonacci retracement at 1.1745 of the 1.1408-1.2082 leg. The major currency pair holds a constructive bullish bias as it stays above the 20-day exponential moving average (EMA), which is around 1.1703. This positioning suggests that pullbacks could be considered for dip-buying.
The Relative Strength Index (RSI) at about 56 leans to the topside without yet signaling overbought conditions.
On the topside, immediate resistance emerges at the 61.8% Fibonacci retracement near 1.1825, followed by 1.1938 at the 78.6% retracement and the recent cycle high region around 1.2082.
Looking down, initial support is seen at the 20-period EMA at 1.1703; a break lower would expose deeper Fibonacci supports at 1.1666 and then 1.1567, with 1.1408 acting as a more distant structural floor.
(The technical analysis of this story was written with the help of an AI tool.)
Economic Indicator
ISM Manufacturing PMI
The Institute for Supply Management (ISM) Manufacturing Purchasing Managers Index (PMI), released on a monthly basis, is a leading indicator gauging business activity in the US manufacturing sector. The indicator is obtained from a survey of manufacturing supply executives based on information they have collected within their respective organizations. Survey responses reflect the change, if any, in the current month compared to the previous month. A reading above 50 indicates that the manufacturing economy is generally expanding, a bullish sign for the US Dollar (USD). A reading below 50 signals that factory activity is generally declining, which is seen as bearish for USD.
Read more.Next release: Fri May 01, 2026 14:00
Frequency: Monthly
Consensus: 53
Previous: 52.7
Source: Institute for Supply Management
The Institute for Supply Management’s (ISM) Manufacturing Purchasing Managers Index (PMI) provides a reliable outlook on the state of the US manufacturing sector. A reading above 50 suggests that the business activity expanded during the survey period and vice versa. PMIs are considered to be leading indicators and could signal a shift in the economic cycle. Stronger-than-expected prints usually have a positive impact on the USD. In addition to the headline PMI, the Employment Index and the Prices Paid Index numbers are watched closely as they shine a light on the labour market and inflation.
Author

Sagar Dua
FXStreet
Sagar Dua is associated with the financial markets from his college days. Along with pursuing post-graduation in Commerce in 2014, he started his markets training with chart analysis.


