When is the US ISM Manufacturing PMI for January and how could it affect EUR/USD?

The United States (US) Institute of Supply Management (ISM) Manufacturing Purchasing Managers’ Index (PMI) data for January is scheduled to be published today at 15:00 GMT.
The ISM is expected to show that the manufacturing sector activity has started the year on a weak note. Economists expect the manufacturing output to have contracted again, but at a moderate pace. The Manufacturing PMI is seen at 48.3, higher than 47.9 in December. A figure below 50.0 is considered a contraction in the business activity.
Apart from the Manufacturing PMI, investors will also focus on sub-components of data, such as the Employment Index, New Orders Index, and Prices Paid.
Weaker-than-projected US ISM Manufacturing PMI data would prompt expectations for interest rate cuts by the Federal Reserve (Fed), as policymakers have remained concerned over the economic outlook. However, better figures would be a relief for Fed officials, but will unlikely act as a major drag on Fed dovish expectations.
How could US ISM Manufacturing PMI affect EUR/USD?
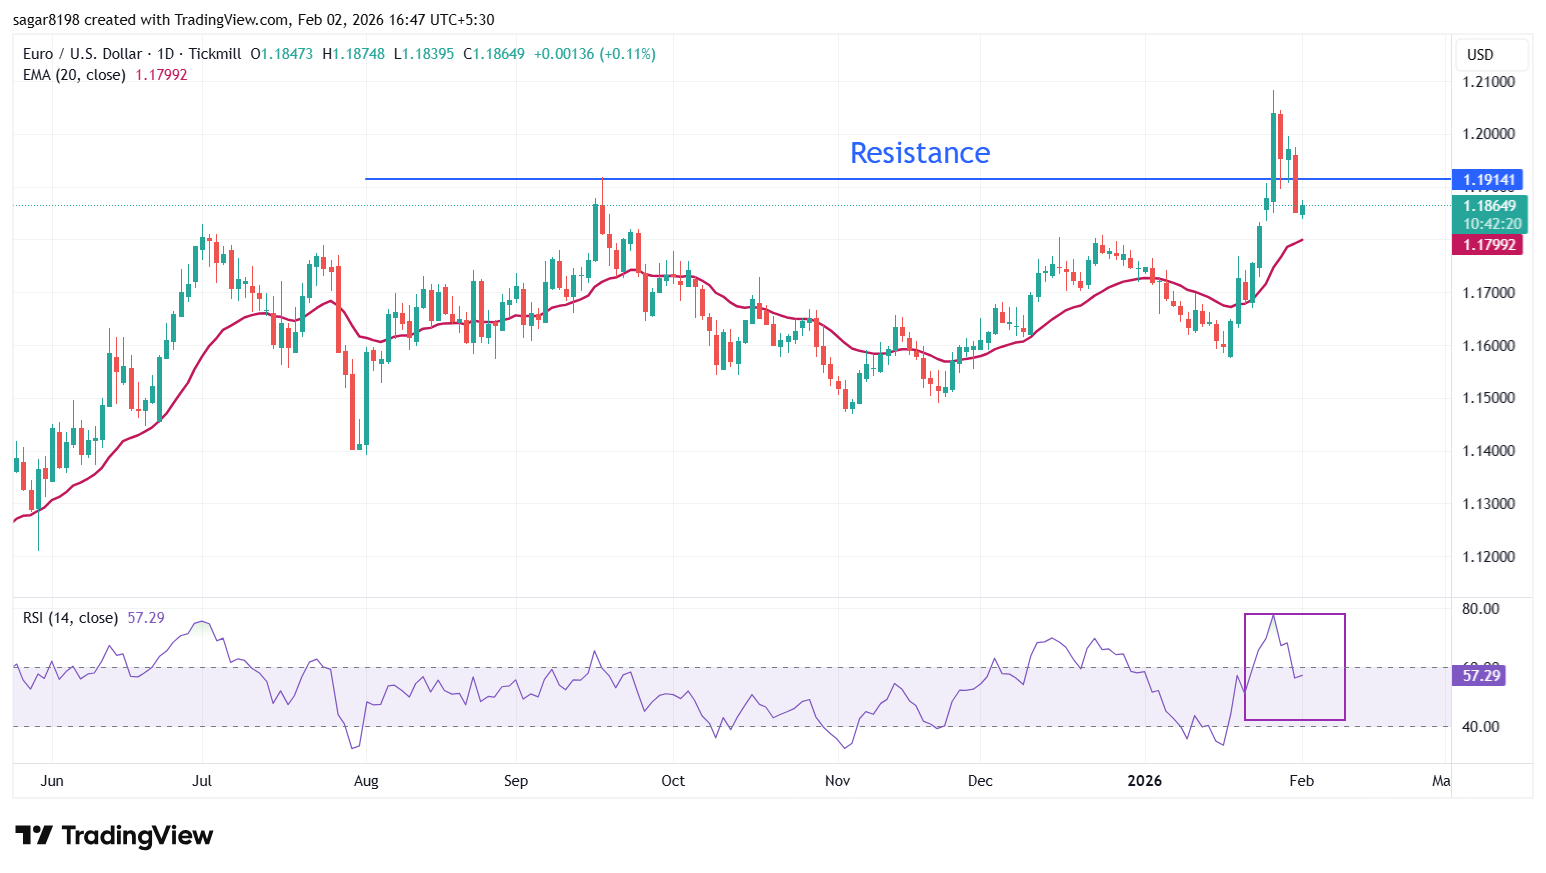
EUR/USD trades marginally higher to near 1.1865 at the press time. The major currency pair holds above the 20-day Exponential Moving Average (EMA), signifying that the upside trend remains intact.
The 14-day Relative Strength Index (RSI) cools down to 57.30 from overbought levels near 80.00, hinting at a possible return of bulls, with the momentum oscillator remaining above the midline of 50.00 (neutral).
On the upside, the January high of 1.2082 will remain a key barrier for the bulls. Looking down, the 20-day EMA will act as a major support zone.
Economic Indicator
ISM Manufacturing PMI
The Institute for Supply Management (ISM) Manufacturing Purchasing Managers Index (PMI), released on a monthly basis, is a leading indicator gauging business activity in the US manufacturing sector. The indicator is obtained from a survey of manufacturing supply executives based on information they have collected within their respective organizations. Survey responses reflect the change, if any, in the current month compared to the previous month. A reading above 50 indicates that the manufacturing economy is generally expanding, a bullish sign for the US Dollar (USD). A reading below 50 signals that factory activity is generally declining, which is seen as bearish for USD.
Read more.Next release: Mon Feb 02, 2026 15:00
Frequency: Monthly
Consensus: 48.3
Previous: 47.9
Source: Institute for Supply Management
The Institute for Supply Management’s (ISM) Manufacturing Purchasing Managers Index (PMI) provides a reliable outlook on the state of the US manufacturing sector. A reading above 50 suggests that the business activity expanded during the survey period and vice versa. PMIs are considered to be leading indicators and could signal a shift in the economic cycle. Stronger-than-expected prints usually have a positive impact on the USD. In addition to the headline PMI, the Employment Index and the Prices Paid Index numbers are watched closely as they shine a light on the labour market and inflation.
Author

Sagar Dua
FXStreet
Sagar Dua is associated with the financial markets from his college days. Along with pursuing post-graduation in Commerce in 2014, he started his markets training with chart analysis.