Breaking: US ISM Manufacturing PMI missed expectations in November
- The US ISM Manufacturing PMI missed consensus in November.
- The US Dollar remains well on the back foot on Monday.

The Institute for Supply Management’s (ISM) data showed the Manufacturing PMI edging lower to 48.2 in November, down from 48.7 in October and short of analysts’ expectations of 48.6.
Meanwhile, the Prices Paid Index, which tracks inflation, rose to 58.5 from 58, the Employment Index weakened to 44 from 46, and the New Orders Index deflated to 47.4 from 49.4.
Market reaction
The Greenback extends its downbeat performance at the beginning of the week, motivating the US Dollar Index (DXY) to retreat toward key support around 99.00, down for the seventh consecutive day.
US Dollar Price Today
The table below shows the percentage change of US Dollar (USD) against listed major currencies today. US Dollar was the strongest against the New Zealand Dollar.
| USD | EUR | GBP | JPY | CAD | AUD | NZD | CHF | |
|---|---|---|---|---|---|---|---|---|
| USD | -0.31% | -0.09% | -0.81% | -0.10% | -0.19% | -0.06% | -0.14% | |
| EUR | 0.31% | 0.22% | -0.45% | 0.21% | 0.12% | 0.24% | 0.16% | |
| GBP | 0.09% | -0.22% | -0.66% | -0.01% | -0.10% | 0.03% | -0.05% | |
| JPY | 0.81% | 0.45% | 0.66% | 0.65% | 0.55% | 0.68% | 0.60% | |
| CAD | 0.10% | -0.21% | 0.00% | -0.65% | -0.10% | 0.03% | -0.04% | |
| AUD | 0.19% | -0.12% | 0.10% | -0.55% | 0.10% | 0.13% | 0.05% | |
| NZD | 0.06% | -0.24% | -0.03% | -0.68% | -0.03% | -0.13% | -0.08% | |
| CHF | 0.14% | -0.16% | 0.05% | -0.60% | 0.04% | -0.05% | 0.08% |
The heat map shows percentage changes of major currencies against each other. The base currency is picked from the left column, while the quote currency is picked from the top row. For example, if you pick the US Dollar from the left column and move along the horizontal line to the Japanese Yen, the percentage change displayed in the box will represent USD (base)/JPY (quote).
This section below was published as a preview of the US ISM Manufacturing report for November at 11:50 GMT.
The United States (US) Institute of Supply Management (ISM) Manufacturing Purchasing Managers’ Index (PMI) data for November is due for release today at 15:00 GMT.
Investors will closely monitor the Manufacturing PMI data to get an overview of overall factory activities. The ISM is expected to show that the Manufacturing PMI dropped to 48.6 from 48.7 in October. This is the ninth straight month when the Manufacturing PMI is expected to come in below 50.0. A figure below 50.0 is considered as contraction in the economic activity.
In addition to the PMI data, investors will also focus on sub-components, such as Prices Paid, Employment Index, and New Orders Index. The Manufacturing Prices Paid index, which reflects changes in input prices, is estimated to have increased to 59.5 from the prior reading of 58.0.
How could US ISM Manufacturing PMI affect EUR/USD?
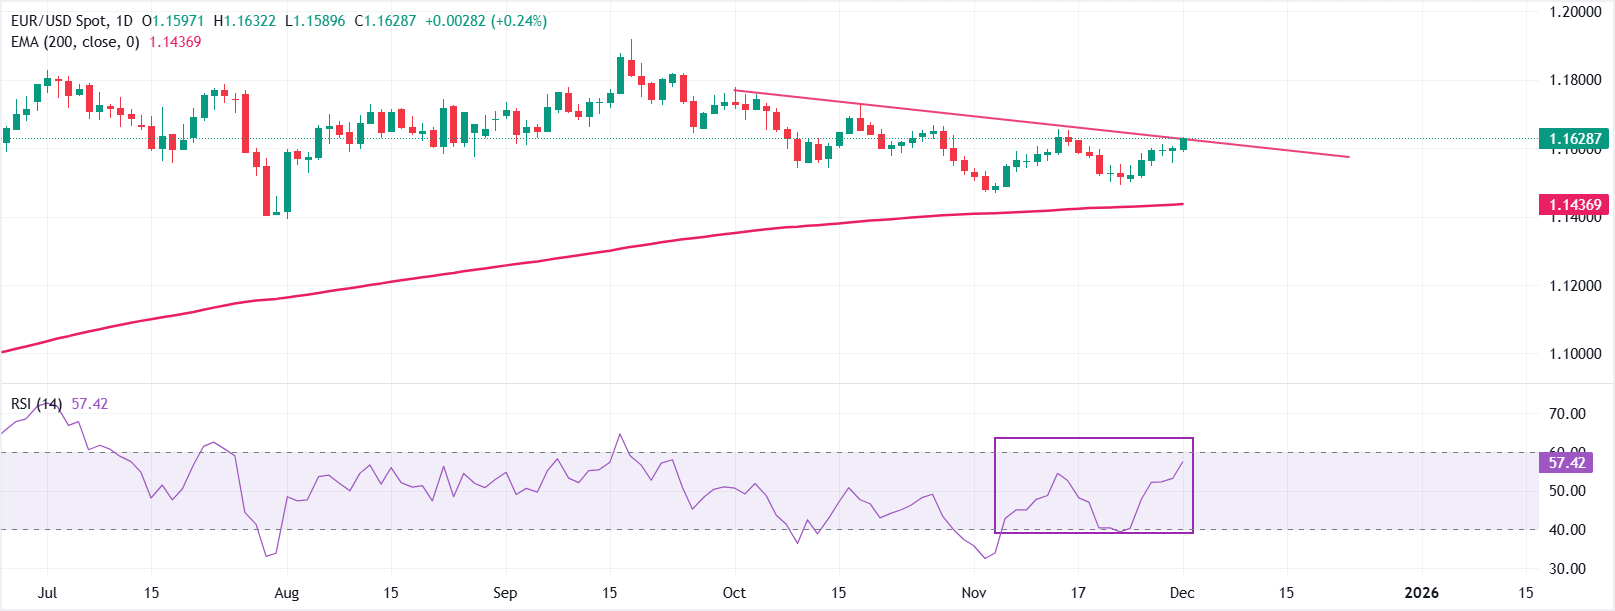
In the daily chart, EUR/USD trades at 1.1629 during the European trading session. The major currency pair holds above the rising 200-day Exponential Moving Average (EMA) at 1.1437, exhibiting a positive trend. The 200-day EMA’s gentle ascent supports the nascent uptrend.
The 14-day Relative Strength Index (RSI) at 57 (bullish side of neutral) confirms strengthening momentum without overbought conditions-day .
A break above the descending trend line resistance at 1.1625 would point to a shift toward the upside and will improve the technical tone.
The descending trend line drawn from 1.1770 has been cleared, and the pair would extend gains while it holds above the breakout area. Pullbacks could find demand around the 200-day EMA, while sustained strength above the current level keeps the short-term bias pointed higher.
(The technical analysis of this story was written with the help of an AI tool)
Economic Indicator
ISM Manufacturing PMI
The Institute for Supply Management (ISM) Manufacturing Purchasing Managers Index (PMI), released on a monthly basis, is a leading indicator gauging business activity in the US manufacturing sector. The indicator is obtained from a survey of manufacturing supply executives based on information they have collected within their respective organizations. Survey responses reflect the change, if any, in the current month compared to the previous month. A reading above 50 indicates that the manufacturing economy is generally expanding, a bullish sign for the US Dollar (USD). A reading below 50 signals that factory activity is generally declining, which is seen as bearish for USD.
Read more.Next release: Mon Dec 01, 2025 15:00
Frequency: Monthly
Consensus: 48.6
Previous: 48.7
Source: Institute for Supply Management
The Institute for Supply Management’s (ISM) Manufacturing Purchasing Managers Index (PMI) provides a reliable outlook on the state of the US manufacturing sector. A reading above 50 suggests that the business activity expanded during the survey period and vice versa. PMIs are considered to be leading indicators and could signal a shift in the economic cycle. Stronger-than-expected prints usually have a positive impact on the USD. In addition to the headline PMI, the Employment Index and the Prices Paid Index numbers are watched closely as they shine a light on the labour market and inflation.
Author

FXStreet Team
FXStreet
Composed of a group of economic journalists and FX experts, the FXStreet content team produces and oversees all content published on FXStreet. It provides a purely journalistic approach to the Forex market.