What’s next for Conoco Phillips?

Last week’s decline took stocks under a lower line of interesting formation. Will it open the way to the south?
Analyzing the breakdown
Invalidation of the breakout, a closure below the lower border of the very short-term consolidation, and disturbing candlestick seen from the weekly perspective. How could this combination of technical factors affect market participants in the coming week? If you want to find out what the most likely scenarios are, I encourage you to read today's article.
Let’s start today's analysis with the quote from the last commentary on Conoco Phillips posted on Jan.29:
(…) How high could stocks go?
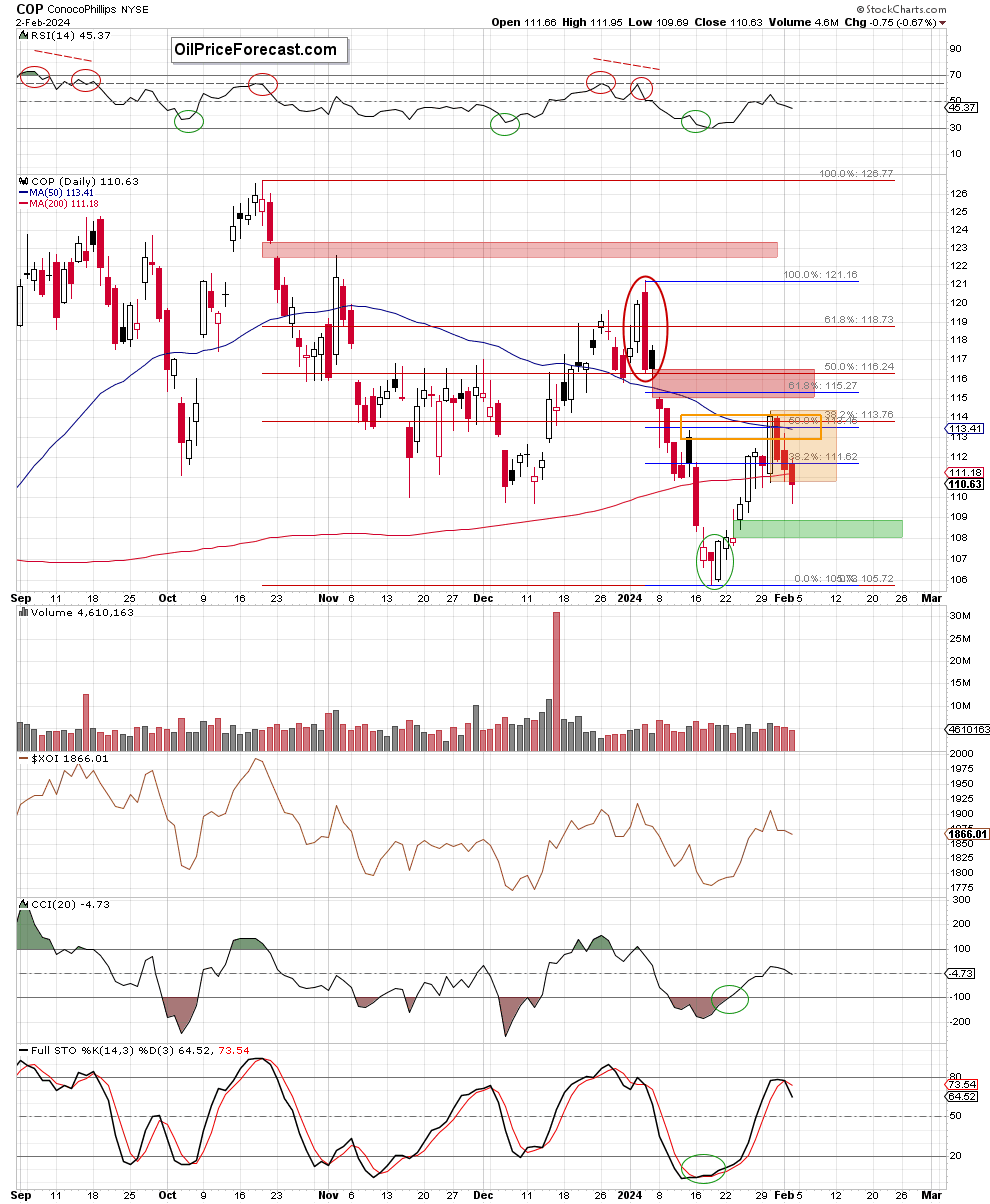
(…) recent price action took stocks above the 38.2% Fibonacci retracement (based on the entire Jan.4-Jan.18 downward move), which, together with buy signals (generated previously by the daily indicators) suggests that we’ll likely see a test of the next resistance area (created by the 50% Fibonacci retracement, the Jan. 12 peak and the 50-day moving average) in the coming week.
Critical support in jeopardy
From today’s point of view, we see that the situation developed in line with the above scenario, and stocks tested the above-mentioned upside target in the previous week.
Although the 38.2% Fibonacci retracement (based on the entire Jan.4-Jan.18 downward move) encouraged some sellers to act, the 200-day moving average was strong enough to stop their appetite for lower prices.
As a result, the bulls came back into the trading floor and triggered a sharp move to the upside, which took the price slightly above the mentioned upside target. Despite this improvement, they didn’t manage to hold gained levels, which translated into a pullback and a comeback under the previously broken resistances in the following session.
In this way, the sellers invalidated the earlier breakout, which encouraged the bears to test the strength of the 200-day moving average once again. On Friday, it failed to protect the way to the south, which caused a daily closure under this important support.
Thanks to this bulls’ failure, the price also closed the day below the lower border of the orange consolidation, which suggests that further deterioration may be just around the corner – especially when we take into account a sell signal generated by the Stochastic Oscillator.
On top of that, when we take a closer look at the weekly chart below, we’ll notice that the bears gained one more ally.

From this perspective, we see that last week’ move to the downside left on the medium-term chart a red candle with prolonged upper shadow, which materialized on increased volume (compared to the volume which materialized the previous white candle), which confirms bears’ increased activity around its high of 110.28 and suggests that they may want to (at least) test the strength of the 50-week moving average (currently at 109.43) in the coming week.
Nevertheless, considering the above-mentioned breakdown (under the lower border of the orange consolidation seen on the daily chart), it seems that we could see a decline even to around 107.19, where the size of the downward move would correspond to the height of the formation.
Will the bears really be able to push the price so low and implement this pro-declining scenario in the coming days?
In my opinion, the way to the south is not as wide open as it may seem. Why? Because if the price moves lower, the first downside target for the sellers would be the supportive space of the green gap (107.99-108.92) formed on Jan. 24.
At this point, it is worth keeping in mind that this support is also a part of the island reversal formation (about which you could read a week ago), which suggests that the bulls should be more active in this area and protect its ally.
Nevertheless, if they fail and let their opponents close the gap, the way to the realization of the bearish scenario (based on the orange consolidation) or even to a test of the bullish engulfing patterns can’t be ruled out.
Summing up, although bulls showed some strength in the first half of the previous week, they didn’t manage to hold gained levels, which translated into a pullback and a closure below the lower border of the very short-term consolidation. This show of weakness suggests that further deterioration and a test of the green supportive gap may be just around the corner.
Want free follow-ups to the above article and details not available to 99%+ investors? Sign up to our free newsletter today!
Want free follow-ups to the above article and details not available to 99%+ investors? Sign up to our free newsletter today!
Premium
You have reached your limit of 3 free articles for this month.
Start your subscription and get access to all our original articles.
Author

Anna Radomska
Sunshine Profits
Anna's passion for drawing evolved into a fascination with colorful lines and shapes, which later inspired her interest in the stock market.


