What to watch on Monday: Barrick Gold (ABX Stock)

Barrick Gold Corporation (#BarrickGold) is scheduled to announce its Q2 2021 results on 9th August, before the market open. Founded in 1983, the Canada-based company has engaged in the production and sales of gold and copper, exploration activities and mine development.
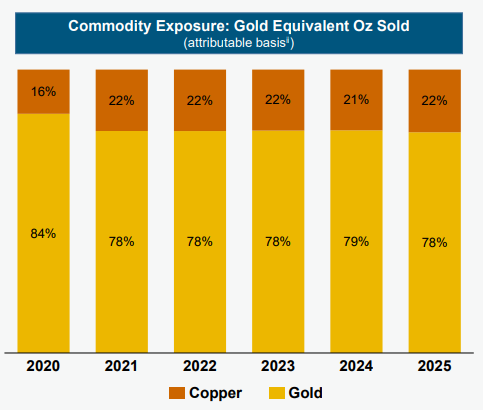
Figure 1: Commodity Exposure: Gold Equivalent Oz Sold (attributable basis).
To date, Barrick Gold has 16 operating sites in 13 countries. It operates 5 of the 10 largest gold mines in the world. This year, as stated by the company in March, the commodity exposure ratio of Gold: Copper equals to 78%:22%, as compared to previous year’s 84%:16%. It is expected for copper exposure to remain above 20% for the coming few years.
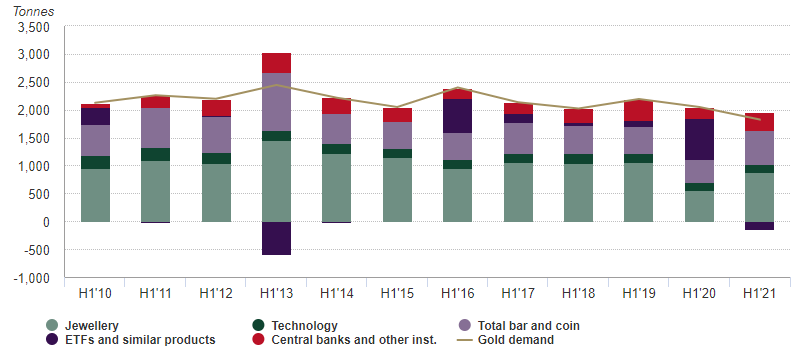
Figure 2: First-Half Demand by Sector, Tonnes.
As reported by the World Gold Council in late July, global demand towards gold in the second quarter remains flat, and down 10% (y/y) throughout the first half (H1) of 2021. Demand towards jewelry is the highest compared to other gold assets, near 880 tonnes, yet remained 17% below the 2015-19 average; Bar and coin investment throughout the first six months this year has recorded the most robust growth since 2013, at 594 tonnes; Central bank gold purchases were 39% and 29% higher than the five-year and ten-year H1 average, respectively. On the other hand, gold ETF inflow saw its first net outflows since 2014, due to Q2 inflows not being able to fully offset the heavy outflows seen in Q1.
For copper, fundamentals that could support the strength of the precious metal in the near term include demand from infrastructure spending, supply-side constraints, its role in global decarbonization and global economic recovery (especially in advanced countries) that continues to advance.
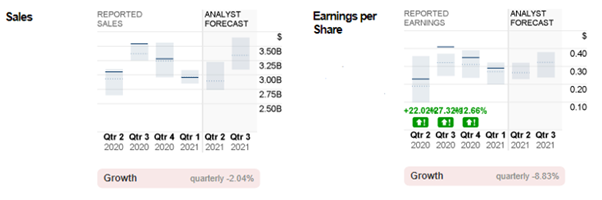
Figure 3: Reported Sales and EPS versus Analyst Forecast for Barrick Gold.
Back to the Barrick Gold Corporation. In Q1 it reported sales revenue near $3.0B, down 9.85% (q/q) but up 8.64% (y/y); Adjusted EPS last stood at $0.29, over 17% below the quarter before, but over 80% higher than the same period last year. Free cash flow remains solid, at $0.763B, with net cash improved by $0.5B (q/q) after tax payment. Dividend payout to investors was $0.09/share, same as those in Q4/2020.
For the upcoming announcement, consensus estimate for sales stands at $2.9B, down 3.33% (q/q) from the previous quarter and down 6.45% (y/y) from the same period last year. For EPS, it is expected to hit $0.26, down 10.35% (q/q) but up 13.04% (y/y).
According to the company’s Q2 preliminary report in mid-July, reported sales of gold and copper stood at 1.07 million ounces and 96 million pounds, respectively. On the other hand, gold production was lower than in Q1 following planned maintenance shutdowns, while copper production was slightly higher than in Q1. Nonetheless, Barrick predicts both gold and copper production to be stronger than the first half of the year. The management of the company remains optimistic towards its outlook in the near term, stating “we remain on track to achieve 2021 guidance”.
Technical analysis
Sentiment of 14 analysts remains positive, with a buy rating kept unchanged and median price target set at $29.00, which is still over 35% above the latest close price, and 14.35% above the highest point of this year seen in May, $25.36.
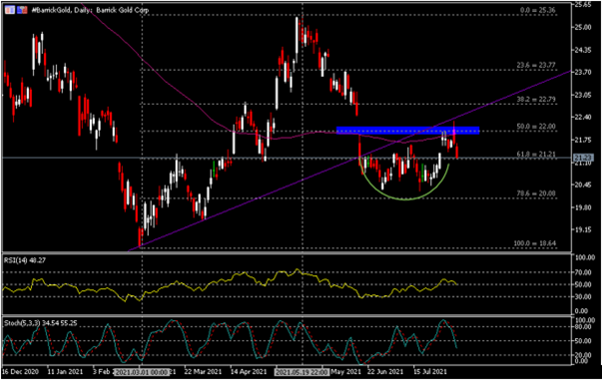
The Daily chart shows that the #BarrickGold share price has experienced a strong uptrend since early March, with lows of the month at $18.80. The gains were massive until all prior losses seen in Jan-Feb/2021 had fully recovered; shortly thereafter, price momentum shifted from bullish to bearish, which led the share price to tumble and resulted in two session lows being formed, at $20.32 (29th June, -24.80%) and $20.26 (19th July, -25.17%). These two lows, together with $20.00 (FR 78.6%, also a psychological level) formed a solid support.
After forming a rounded bottom pattern with the two lows, the company’s share price extended higher and broke above $21.20 (or 61.8% Fib. level), however bullish momentum waned last Wednesday (4th August) and it has failed to break the critical confluence zone, which comprised of trend line Resistance, 100-SMA and 50.0% Fib. level Resistance, or $22.00. The bearish momentum continued yesterday, and the price is currently testing $21.20, the 61.8% Fib. level or the low estimate as offered by the analysts. For momentum indicators, RSI remains neutral near 50, while the Stochastics fast line breaks below 50.
Premium
You have reached your limit of 3 free articles for this month.
Start your subscription and get access to all our original articles.


