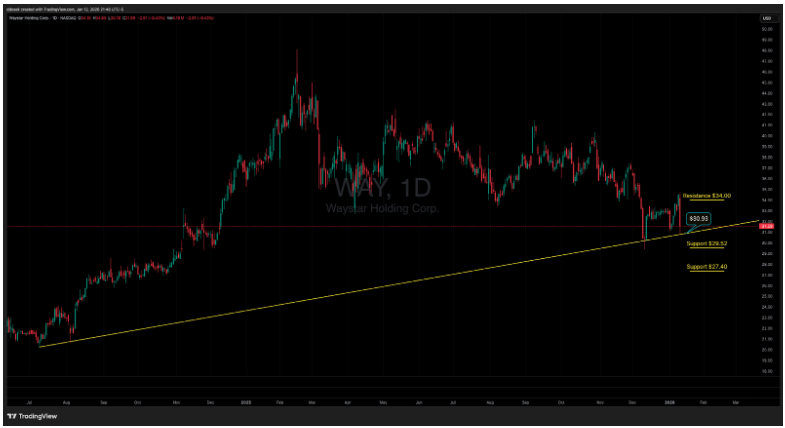
Waystar (WAY) testing the foundation: Why the $30.93 trendline is the line to beat

Technical analysis often boils down to a game of repetition. The more times a level is tested, the more significant it becomes but also, paradoxically, the more fragile it can get. We are seeing this play out in real-time right now on the chart of Waystar as a significant long-term trendline dating back to July 2024 is under immense pressure.
The July anchor
The trendline, roughly $30.93, in question stretches back to July of 2024. The chart for WAY shows that we have now arrived at this trendline for the fourth distinct time. In technical trading, the "Fourth Touch Rule" is often a warning sign. While the first three touches resulted in sharp bounces, this fourth approach is in jeopardy of breaking the trendline as price has hit the trendline recently plus, price was just at this level on January 2nd & 5th.
The red candle resistance
Looking at the recent overhead action, the "red candle" resistance remains a persistent thorn in the side of any recovery attempt. Since December, every time the stock tries to peel away from the inclining trendline, it is met with selling pressure that pushes it back down to the support.
The bottom line
The $30.93 level is the line to beat. The bull case: If the bulls can defend this level for a fourth time and print a strong reversal candle, we could see a relief rally toward the previous local highs, and then potentially $37.00.
- The bear case: If we see a daily close significantly below $30.93, the July 2024 trendline officially breaks. A breach of a year and six-month trendline usually triggers stop-loss orders, which could accelerate a move toward deeper support levels.
Traders should keep a close eye on the volume at this junction. A break with high volume would confirm that the "foundation" for Waystar has finally given way. For now, the stock is teetering on the edge, waiting to see if the long-term trend still has any life left in it.
Author

Drew Dosek
Verified Investing
Passionate technical and cycle analyst committed to empowering traders through data-driven insights.


