|

Walmart (NYSE:WMT) $120 target precedes a dip

Walmart (NYSE: WMT) continues to lead the market following its rebound last year. Today, we examine the Elliott Wave structure behind its current breakout. This analysis charts the precise pathway and key upside targets for its next advance. Our technical blueprint reveals a compelling setup, driven entirely by strong momentum.

Elliott Wave analysis

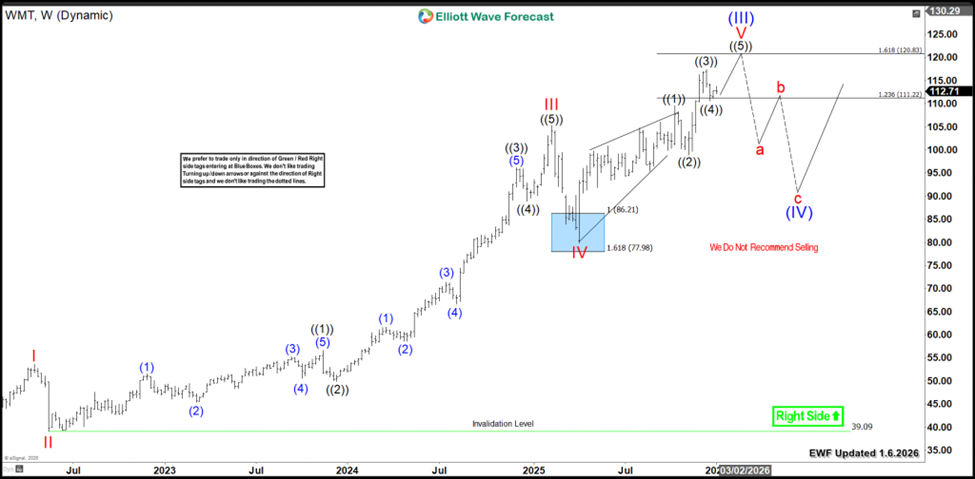
WMT’s recent rally originated from the $86 – $77 Blue Box area. Specifically, buyers emerged during the April 2025 market dip. Subsequently, the stock concluded its wave IV pullback. Then, it traded into new all-time highs within the current wave V.

Currently, it shows three swings into new highs. Therefore, the sequence remains incomplete. Consequently, it needs at least one more swing to finish its five-wave advance from the April low.

Importantly, WMT already trades within the $111 – $120 initial target zone. Hence, investors should avoid chasing the rally here. After wave ((III)) completes, a larger wave ((IV)) pullback will begin. This correction will then create the next strategic buying opportunity before the uptrend resumes.

WMT weekly chart 1.06.2026

Chart

Conclusion

WMT’s weekly bullish cycle remains firmly intact. Therefore, investors should target buying opportunities within weekly pullbacks. Utilize our Elliott Wave strategy for precise entry timing. Specifically, establish positions after a 3, 7, or 11-swing correction completes. Additionally, our proprietary Blue Box system pinpoints high-probability entry zones. Consequently, this disciplined

Author

Elliott Wave Forecast Team

Elliott Wave Forecast Team

ElliottWave-Forecast.com

More from Elliott Wave Forecast Team
Share:

Editor's Picks

EUR/USD stays weak near 1.1650 ahead of critical US events

EUR/USD stays in the red near 1.1650 in the European trading hours on Friday. The pair remains undermined by broad US Dollar strength and a cautious market mood. Traders keenly await the US Nonfarm Payrolls data and Supreme Court's ruling on Trump's tariff powers for further direction. 

GBP/USD holds lower ground below 1.3450, with eyes on US data

GBP/USD remains subdued for the fourth consecutive day, while trading below 1.3450 in the European session on Friday. Markets remain in a wait-and-see mode before the key US event risks and prefer to hold the US Dollar, which weighs negatively on the pair. The US monthly jobs data and the Supreme Court decision on tariffs are awaited. 

Gold flat lines around $4,475; looks to US NFP report for fresh impetus

Gold reverses a modest intraday dip to the $4,453 area, and trades near the top end of its daily range heading into the European session. The upside, however, seems limited as traders might opt to wait for the US Nonfarm Payrolls report later today. The crucial employment details will be looked upon for more cues about the Federal Reserve's rate-cut path.

Nonfarm Payrolls expected to show US labor market remained weak in December

The United States Bureau of Labor Statistics will release the Nonfarm Payrolls data for December on Friday at 13:30 GMT. Economists expect Nonfarm Payrolls to rise by 60,000 in December following the 64,000 increase recorded in November.

2026 economic outlook: Clear skies but don’t unfasten your seatbelts yet

Most years fade into the background as soon as a new one starts. Not 2025: a year of epochal shifts, in which the macroeconomy was the dog that did not bark. What to expect in 2026? The shocks of 2025 will not be undone, but neither will they be repeated.

Pepe Price Forecast: PEPE risks 100-day EMA fallout as bullish interest fades

Pepe is under extreme selling pressure, trading in the red for the fifth consecutive day, down 1% at press time on Friday. Pepe’s decline following a 72% hike last week suggests a likely profit-booking phase, while on-chain data indicates declining network activity.