Walmart Inc (WMT) Elliott Wave technical analysis [Video]
![Walmart Inc (WMT) Elliott Wave technical analysis [Video]](https://editorial.fxstreet.com/images/Markets/Equities/DAX/dax-euro-concept-47253534_XtraLarge.jpg)
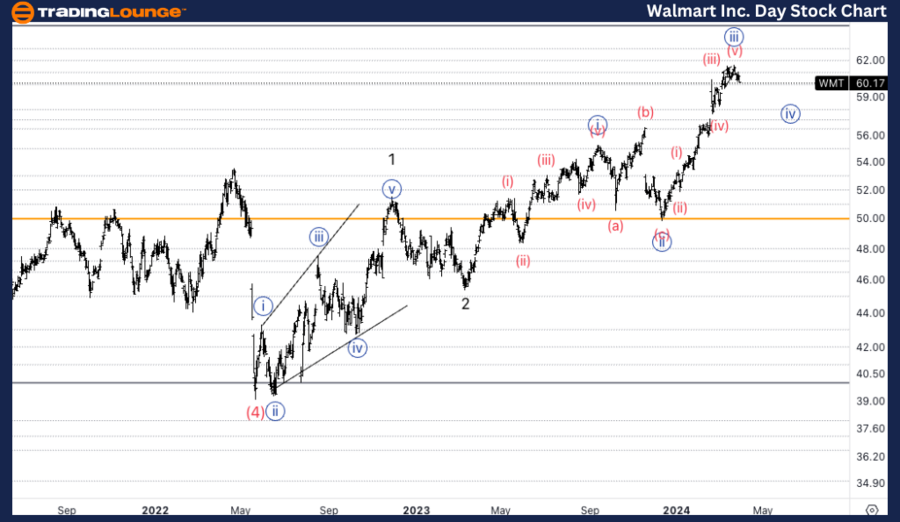
WMT Elliott Wave analysis trading lounge daily chart
Welcome to our WMT Elliott Wave Analysis Trading Lounge, where we delve into Walmart Inc. (WMT) using Elliott Wave Technical Analysis. Let's explore the market dynamics on the Daily Chart.Walmart Inc., (WMT) Daily Chart.
WMT Elliott Wave Technical Analysis.
Function: Trend.
Mode: Impulse.
Structure: Motive.
Position: Minor wave 3 of Intermediate (3).
Direction: Upside in wave 3.
Details: We are looking for Minor wave 3 to unfold in front of our eyes. We could be seeing a potential top in wave {iii}, as we are in an higher degree wave (5) we could also end up forming an ending diagonal.
WMT Elliott Wave technical analysis – Daily chart
Our analysis indicates a trending function characterized by impulse mode and motive structure, positioned in Minor wave 3 of Intermediate (3). The direction signals an upside momentum in wave 3. As we observe the unfolding of Minor wave 3, there's potential for a top formation in wave {iii}. Considering the higher degree wave (5), there's also the possibility of forming an ending diagonal pattern.
WMT Elliott Wave analysis trading lounge
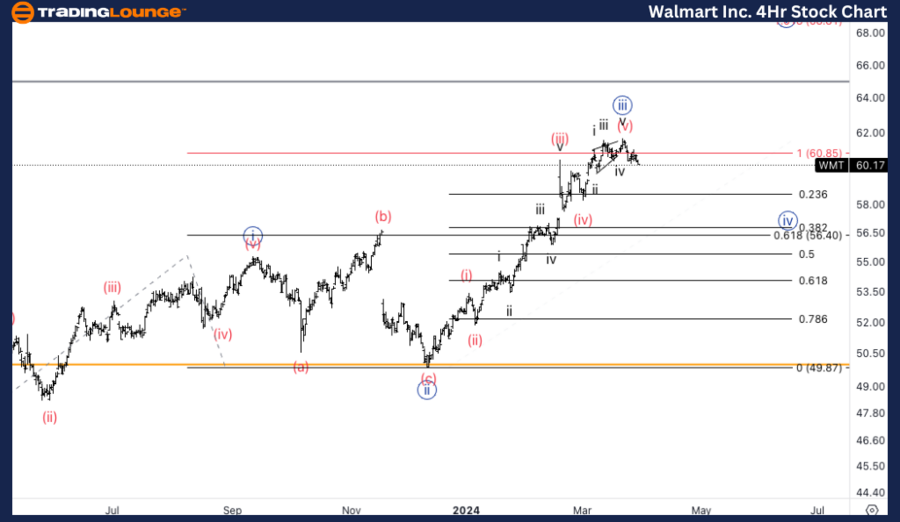
Walmart Inc., (WMT) 4Hr Chart.
WMT Elliott Wave Technical Analysis.
Function: Counter Trend.
Mode: Corrective.
Structure: Zigzag.
Position: Wave (a) of {iv}.
Direction: Downside into wave {iv}.
Details: We could have topped before Medium Level 65$ or else we have not completed wave {iii} yet. We have however reached equality of wave {iii} vs. {i} at 60.84$.
Technical Analyst: Alessio Barretta.
WMT Elliott Wave technical analysis – Four hour chart
Here, we identify a counter trend function marked by corrective mode and zigzag structure, positioned in Wave (a) of {iv}. The direction indicates a downside trajectory into wave {iv}. There's a possibility that we've reached a top before Medium Level $65, or alternatively, wave {iii} might not have completed yet. However, it's noteworthy that we've reached equality of wave {iii} versus {i} at $60.84.
WMT Elliott Wave technical analysis [Video]
Author

Peter Mathers
TradingLounge
Peter Mathers started actively trading in 1982. He began his career at Hoei and Shoin, a Japanese futures trading company.


