Verizon Communications Inc., commonly known as Verizon, is an US American telecommunications giant. Founded in 1983 as Bell Atlantic, it is a result of the break up of the Bell System into seven regional Baby Bells. Headquartered in New York, USA, Verizon is a part of DJIA, S&P100 and S&P500 indices. One can trade it under the ticker $VZ at NYSE.

Verizon monthly Elliott Wave analysis 07.27.2022

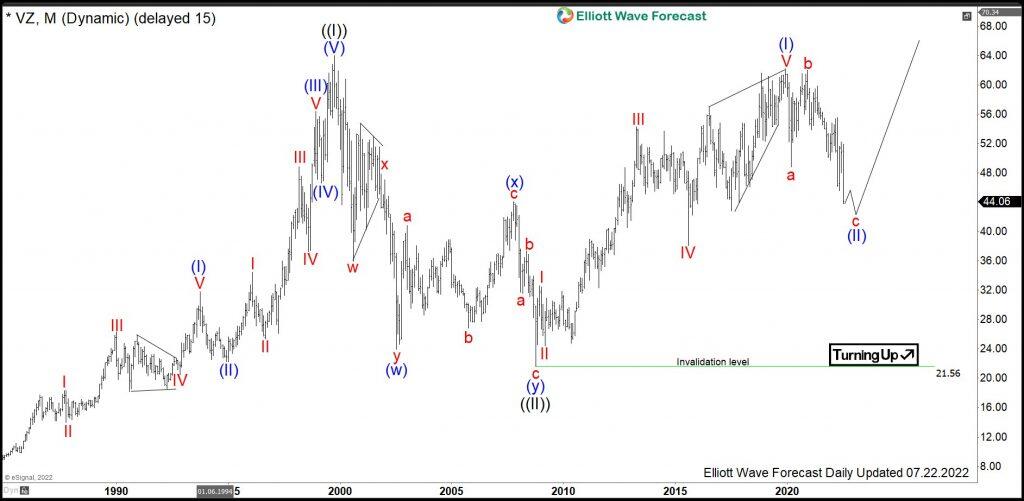
The monthly chart below shows the Verizon stock $VZ traded at NYSE. From the all-time lows, the stock price has developed a grand super cycle in black wave ((I)) towards the all-time highs on October 1999 at 64$. Hereby, the middle part in red wave III of blue wave (III) shows a separation which is a typical feature of an impulse wave. From the October 1999 highs, a correction lower in black wave ((II)) has found its bottom in October 2008 at 21.56 low. From there, a new cycle within wave ((III)) has started and is currently in progress. The target for wave ((III)) will be 85.66-125.31 area and possibly higher.

A closer look on the wave ((III)) reveals that Verizon develops an initial nest before acceleration higher can take place. Hereby, wave (I) of super cycle degree has ended in December 2019 at 62.22. From the highs, a pullback in wave (II) should find support in 3, 7, 11 swings above 21.56 lows. Then acceleration higher in wave (III) of ((III)) should take place.

VZ

Verizon weekly Elliott Wave analysis 07.27.2022

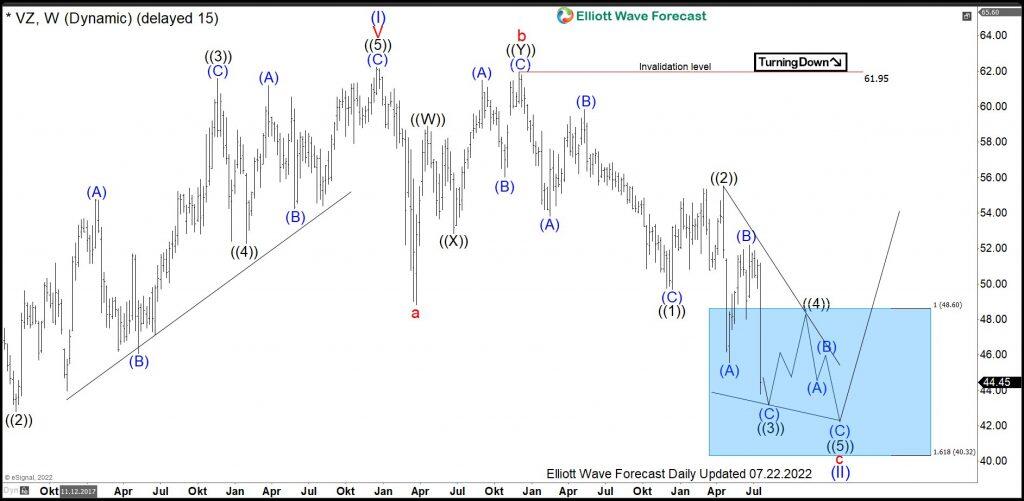
The weekly chart below shows in more detail the pullback in blue wave (II). It shows 3 swings either as a regular flat or as an Elliott wave zigzag pattern. Hereby, the 3rd swing should be in 5 waves. First, the cycle in red wave a has ended in March 2020 at 48.84 lows. From there, a bounce in connector wave b has printed a top in November 2020. From there, the price has broken the 48.84 lows opening up a bearish sequence. The minimum target has been reached, but the pattern looks incomplete. The ending diagonal can still see more downside within waves ((3))-((5)) of red wave c.

Investors and traders can be looking to buy Verizon in pullback from 48.60-40.32 area for long-term strength or for a bounce in 3 waves as minimum. The target for wave (III) will be 62.22 and higher.

VZ

Share: Feed news

FURTHER DISCLOSURES AND DISCLAIMER CONCERNING RISK, RESPONSIBILITY AND LIABILITY Trading in the Foreign Exchange market is a challenging opportunity where above average returns are available for educated and experienced investors who are willing to take above average risk. However, before deciding to participate in Foreign Exchange (FX) trading, you should carefully consider your investment objectives, level of xperience and risk appetite. Do not invest or trade capital you cannot afford to lose. EME PROCESSING AND CONSULTING, LLC, THEIR REPRESENTATIVES, AND ANYONE WORKING FOR OR WITHIN WWW.ELLIOTTWAVE- FORECAST.COM is not responsible for any loss from any form of distributed advice, signal, analysis, or content. Again, we fully DISCLOSE to the Subscriber base that the Service as a whole, the individual Parties, Representatives, or owners shall not be liable to any and all Subscribers for any losses or damages as a result of any action taken by the Subscriber from any trade idea or signal posted on the website(s) distributed through any form of social-media, email, the website, and/or any other electronic, written, verbal, or future form of communication . All analysis, trading signals, trading recommendations, all charts, communicated interpretations of the wave counts, and all content from any media form produced by www.Elliottwave-forecast.com and/or the Representatives are solely the opinions and best efforts of the respective author(s). In general Forex instruments are highly leveraged, and traders can lose some or all of their initial margin funds. All content provided by www.Elliottwave-forecast.com is expressed in good faith and is intended to help Subscribers succeed in the marketplace, but it is never guaranteed. There is no “holy grail” to trading or forecasting the market and we are wrong sometimes like everyone else. Please understand and accept the risk involved when making any trading and/or investment decision. UNDERSTAND that all the content we provide is protected through copyright of EME PROCESSING AND CONSULTING, LLC. It is illegal to disseminate in any form of communication any part or all of our proprietary information without specific authorization. UNDERSTAND that you also agree to not allow persons that are not PAID SUBSCRIBERS to view any of the content not released publicly. IF YOU ARE FOUND TO BE IN VIOLATION OF THESE RESTRICTIONS you or your firm (as the Subscriber) will be charged fully with no discount for one year subscription to our Premium Plus Plan at $1,799.88 for EACH person or firm who received any of our content illegally through the respected intermediary’s (Subscriber in violation of terms) channel(s) of communication.

Recommended content


Recommended content

Editors’ Picks

EUR/USD trades with negative bias, holds above 1.0700 as traders await US PCE Price Index

EUR/USD trades with negative bias, holds above 1.0700 as traders await US PCE Price Index

EUR/USD edges lower during the Asian session on Friday and moves away from a two-week high, around the 1.0740 area touched the previous day. Spot prices trade around the 1.0725-1.0720 region and remain at the mercy of the US Dollar price dynamics ahead of the crucial US data.

EUR/USD News

USD/JPY jumps above 156.00 on BoJ's steady policy

USD/JPY jumps above 156.00 on BoJ's steady policy

USD/JPY has come under intense buying pressure, surging past 156.00 after the Bank of Japan kept the key rate unchanged but tweaked its policy statement. The BoJ maintained its fiscal year 2024 and 2025 core inflation forecasts, disappointing the Japanese Yen buyers. 

USD/JPY News

Gold price flatlines as traders look to US PCE Price Index for some meaningful impetus

Gold price flatlines as traders look to US PCE Price Index for some meaningful impetus

Gold price lacks any firm intraday direction and is influenced by a combination of diverging forces. The weaker US GDP print and a rise in US inflation benefit the metal amid subdued USD demand. Hawkish Fed expectations cap the upside as traders await the release of the US PCE Price Index.

Gold News

Sei Price Prediction: SEI is in the zone of interest after a 10% leap

Sei Price Prediction: SEI is in the zone of interest after a 10% leap

Sei price has been in recovery mode for almost ten days now, following a fall of almost 65% beginning in mid-March. While the SEI bulls continue to show strength, the uptrend could prove premature as massive bearish sentiment hovers above the altcoin’s price.

Read more

US economy: Slower growth with stronger inflation

US economy: Slower growth with stronger inflation

The US Dollar strengthened, and stocks fell after statistical data from the US. The focus was on the preliminary estimate of GDP for the first quarter. Annualised quarterly growth came in at just 1.6%, down from the 2.5% and 3.4% previously forecast.

Read more

Forex MAJORS

Cryptocurrencies

Signatures