|

USD/SGD declines below the 20-day SMA as the USD weakens

  • USD/SGD trades below 1.3700 with 0.20 daily losses.
  • Inflation in Singapore came in slightly lower than expected.
  • The US Dollar trades soft ahead of high-tier economic figures to be released this week.

The USD/SGD declined in Monday's session, mainly driven by the Greenback trading weak against its rivals amid dovish bets on the Federal Reserve (Fed) and lower US Treasury yields. The SGD managed to hold its foot despite lower-than-expected inflation data released during the Asian session, and the focus shifts to key economic activity figures from the US to be released during the week. The economic calendar had nothing relevant to offer on Monday.

The Consumer Price Index (CPI) from Singapore from September came in at 4.1%  YoY, lower than the 4.2% YoY expected but accelerated from its last figure of 4.2% YoY.

On the US side, it trades softs as market speculations lean towards a less aggressive approach by the Federal Reserve (Fed) following Chair Powell's speech last week. In his address, Powell emphasised the need to consider the elevated bond yields and stressed the importance of cautious actions in the next decisions. In that sense, the CME FedWatch tool indicates minimal probabilities, currently at approximately 30%, for a 25 basis points hike in the December meeting, which has led to a decline in interest in the US dollar.


On the data front, the US will release the S&P Manufacturing PMI from October on Tuesday, followed by the Q3 Gross Domestic Product (GDP) on Thursday and the Core Personal Consumption Expenditures from September on Friday. 
  

USD/SGD Levels to watch 

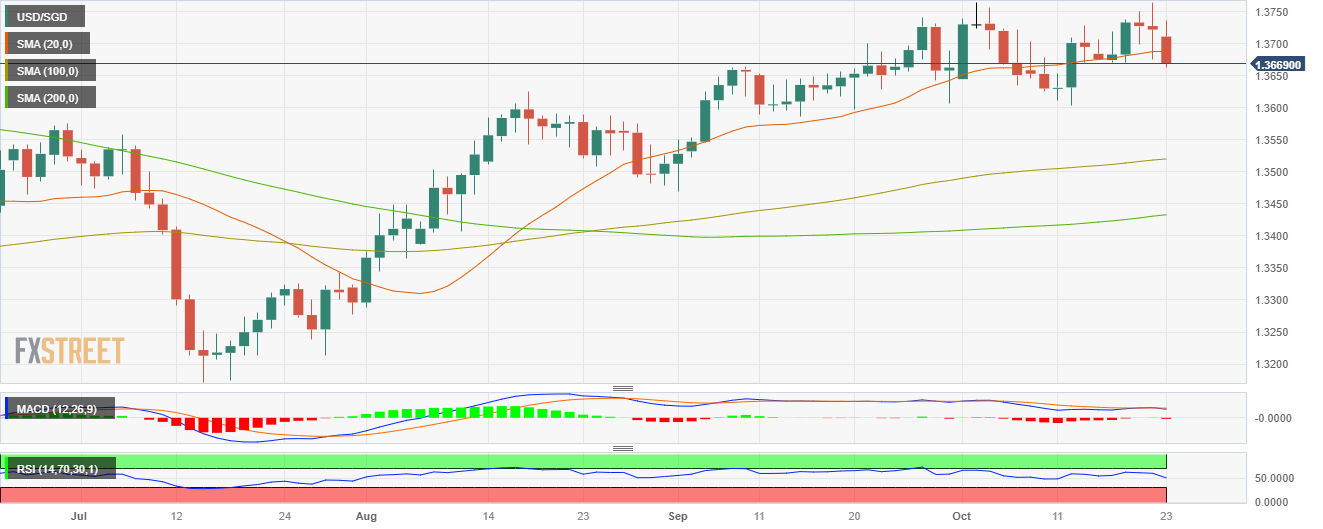
 Analysing the daily chart, USD/SGD exhibits signs of bullish exhaustion, contributing to a neutral to bearish technical perspective. The Relative Strength Index (RSI) displays a negative slope in the bullish territory, hinting at a potential shift in momentum, while the Moving Average Convergence (MACD) shows flat green bars. However, the pair is above the 100 and 200-day Simple Moving Average (SMA), highlighting the continued dominance of bulls on the broader scale.

 Support levels:1.3660, 1.3650, 1.3630. 

 Resistance levels: 1.3690 (20-day SMA), 1.3740, 1.3770, 1.3800. 

USD/SGD Daily chart

USD/SGD

Overview
Today last price1.3671
Today Daily Change-0.0051
Today Daily Change %-0.37
Today daily open1.3722
 
Trends
Daily SMA201.3688
Daily SMA501.363
Daily SMA1001.3518
Daily SMA2001.3431
 
Levels
Previous Daily High1.3765
Previous Daily Low1.3675
Previous Weekly High1.3765
Previous Weekly Low1.367
Previous Monthly High1.3741
Previous Monthly Low1.347
Daily Fibonacci 38.2%1.3709
Daily Fibonacci 61.8%1.3731
Daily Pivot Point S11.3676
Daily Pivot Point S21.3631
Daily Pivot Point S31.3586
Daily Pivot Point R11.3766
Daily Pivot Point R21.3811
Daily Pivot Point R31.3856

Author

Patricio Martín

Patricio is an economist from Argentina passionate about global finance and understanding the daily movements of the markets.

More from Patricio Martín
Share:

Markets move fast. We move first.

Orange Juice Newsletter brings you expert driven insights - not headlines. Every day on your inbox.

By subscribing you agree to our Terms and conditions.

Editor's Picks

EUR/USD moves sideways below 1.1800 on Christmas Eve

EUR/USD struggles to find direction and trades in a narrow channel below 1.1800 after posting gains for two consecutive days. Bond and stock markets in the US will open at the usual time and close early on Christmas Eve, allowing the trading action to remain subdued. 

GBP/USD keeps range around 1.3500 amid quiet markets

GBP/USD keeps its range trade intact at around 1.3500 on Wednesday. The Pound Sterling holds the upper hand over the US Dollar amid pre-Christmas light trading as traders move to the sidelines heading into the holiday season. 

Gold retreats from record highs, trades below $4,500

Gold retreats after setting a new record-high above $4,520 earlier in the day and trades in a tight range below $4,500 as trading volumes thin out ahead of the Christmas break. The US Dollar selling bias remains unabated on the back of dovish Fed expectations, which continues to act as a tailwind for the bullion amid persistent geopolitical risks.

Bitcoin slips below $87,000 as ETF outflows intensify, whale participation declines

Bitcoin price continues to trade around $86,770 on Wednesday, after failing to break above the $90,000 resistance. US-listed spot ETFs record an outflow of $188.64 million on Tuesday, marking the fourth consecutive day of withdrawals.

Economic outlook 2026-2027 in advanced countries: Solidity test

After a year marked by global economic resilience and ending on a note of optimism, 2026 looks promising and could be a year of solid economic performance. In our baseline scenario, we expect most of the supportive factors at work in 2025 to continue to play a role in 2026.

Avalanche struggles near $12 as Grayscale files updated form for ETF

Avalanche trades close to $12 by press time on Wednesday, extending the nearly 2% drop from the previous day. Grayscale filed an updated form to convert its Avalanche-focused Trust into an ETF with the US Securities and Exchange Commission.