|

USD/MXN Price Analysis: Struggles for a firm near-term direction, stuck in a range above 17.00

  • USD/MXN extends its consolidative price moves and remains confined in a familiar range.
  • The technical setup favours bearish traders and supports prospects for additional losses.
  • A sustained strength above the 17.20-25 area is needed to negate the negative outlook.

The USD/MXN pair struggles to capitalize on the previous day's positive move and oscillates in a narrow trading band, just above the 17.00 mark through the Asian session on Friday.

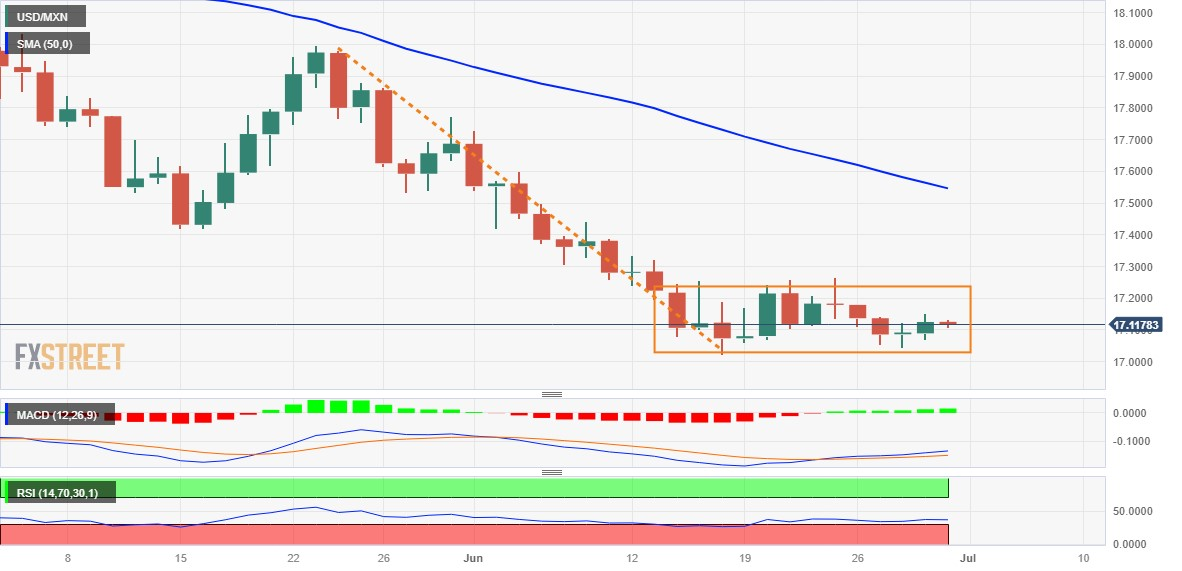
The range-bound price action witnessed over the past two weeks or so constitutes the formation of a rectangle on the daily chart. Against the backdrop of the recent downfall from the 18.00 mark touched on May 23, this might still be categorized as a bearish consolidation phase and supports prospects for additional losses. The negative outlook is reinforced by the fact that oscillators on the daily chart have recovered from the oversold zone and are holding deep in the bearish territory.

The aforementioned technical setup suggests that the path of least resistance for the USD/MXN pair is to the downside. That said, it will still be prudent to wait for a sustained break and acceptance below the 17.00 round figure before positioning for the resumption of over a three-month-old descending trend. Spot prices might then turn vulnerable to accelerate the slide towards the 16.60-16.55 intermediate support before dropping to November 2015 low, around the 16.35 area.

On the flip side, last week's swing high, around the 17.20-17.25 region, also representing the trading range barrier, should cap the immediate upside for the USD/MXN pair. A sustained strength beyond might trigger a short-covering rally towards the 17.40-17.45 region. This is closely followed by the 50-day Simple Moving Average (SMA), currently pegged near the 17.55 zone, which if cleared will suggest that spot prices have bottomed out and pave the way for further gains.

USD/MXN daily chart

fxsoriginal

Key levels to watch

USD/MXN

Overview
Today last price17.1164
Today Daily Change-0.0088
Today Daily Change %-0.05
Today daily open17.1252
 
Trends
Daily SMA2017.223
Daily SMA5017.5638
Daily SMA10017.9462
Daily SMA20018.7188
 
Levels
Previous Daily High17.153
Previous Daily Low17.0694
Previous Weekly High17.2656
Previous Weekly Low17.061
Previous Monthly High18.078
Previous Monthly Low17.4203
Daily Fibonacci 38.2%17.1211
Daily Fibonacci 61.8%17.1013
Daily Pivot Point S117.0788
Daily Pivot Point S217.0323
Daily Pivot Point S316.9952
Daily Pivot Point R117.1624
Daily Pivot Point R217.1995
Daily Pivot Point R317.246

Author

Haresh Menghani

Haresh Menghani is a detail-oriented professional with 10+ years of extensive experience in analysing the global financial markets.

More from Haresh Menghani
Share:

Editor's Picks

GBP/USD clings to daily gains near 1.3350

GBP/USD holds just in positive territory around 1.3350 on Friday as the Greenback keeps a vacillating price action. With Fed rate hike expectations easing and US markets closed for the Independence Day holiday, Cable remains on track to post solid weekly gains.

EUR/USD remains sidelined around 1.1440

EUR/USD holds on to its recent gains and consolidates around 1.1440 at the end of the week as the US Dollar lacks clear direction. In the meantime, trading conditions remain subdued, with volatility constrained by the closure of US markets for the Independence Day holiday.

Gold flirts with two-week highs, targets $4,200

Gold extends its recovery for a third straight day, advancing toward the $4,200 mark per troy ounce on Friday. The precious metal looks set to snap a four-week losing streak as softer-than-expected June US NFP data prompt investors to scale back expectations of further Fed tightening.

Crypto Today: Bitcoin, Ethereum, XRP advance amid renewed capital inflows

Bitcoin maintains its upward momentum, holding above the $61,000 mark at the time of writing on Friday. Major altcoins such as Ethereum and Ripple are also posting gains, signaling a modest uptick in market sentiment and renewed risk appetite among investors.

The Iran war failed to trigger a recession. Can the US economy keep defying expectations?

Nearly four months after the start of the Iran war, the US economy remains remarkably resilient. While the conflict initially triggered a severe disruption to global energy markets and a sharp rise in Oil prices, recent diplomatic progress between Washington and Tehran has eased concerns about a prolonged supply shock.

Kevin Warsh offers no policy clues: Why markets still got their answer

Financial markets came to Sintra looking for clues about the Federal Reserve's (Fed) next move. They largely left with confirmation that Fed Chair Kevin Warsh intends to make those clues much harder to find.