|

USD/MXN Price Analysis: Plummets to six-year lows with sellers eyeing 17.50

  • The strong downtrend in USD/MXN continues as emerging market currencies advance against the US Dollar.
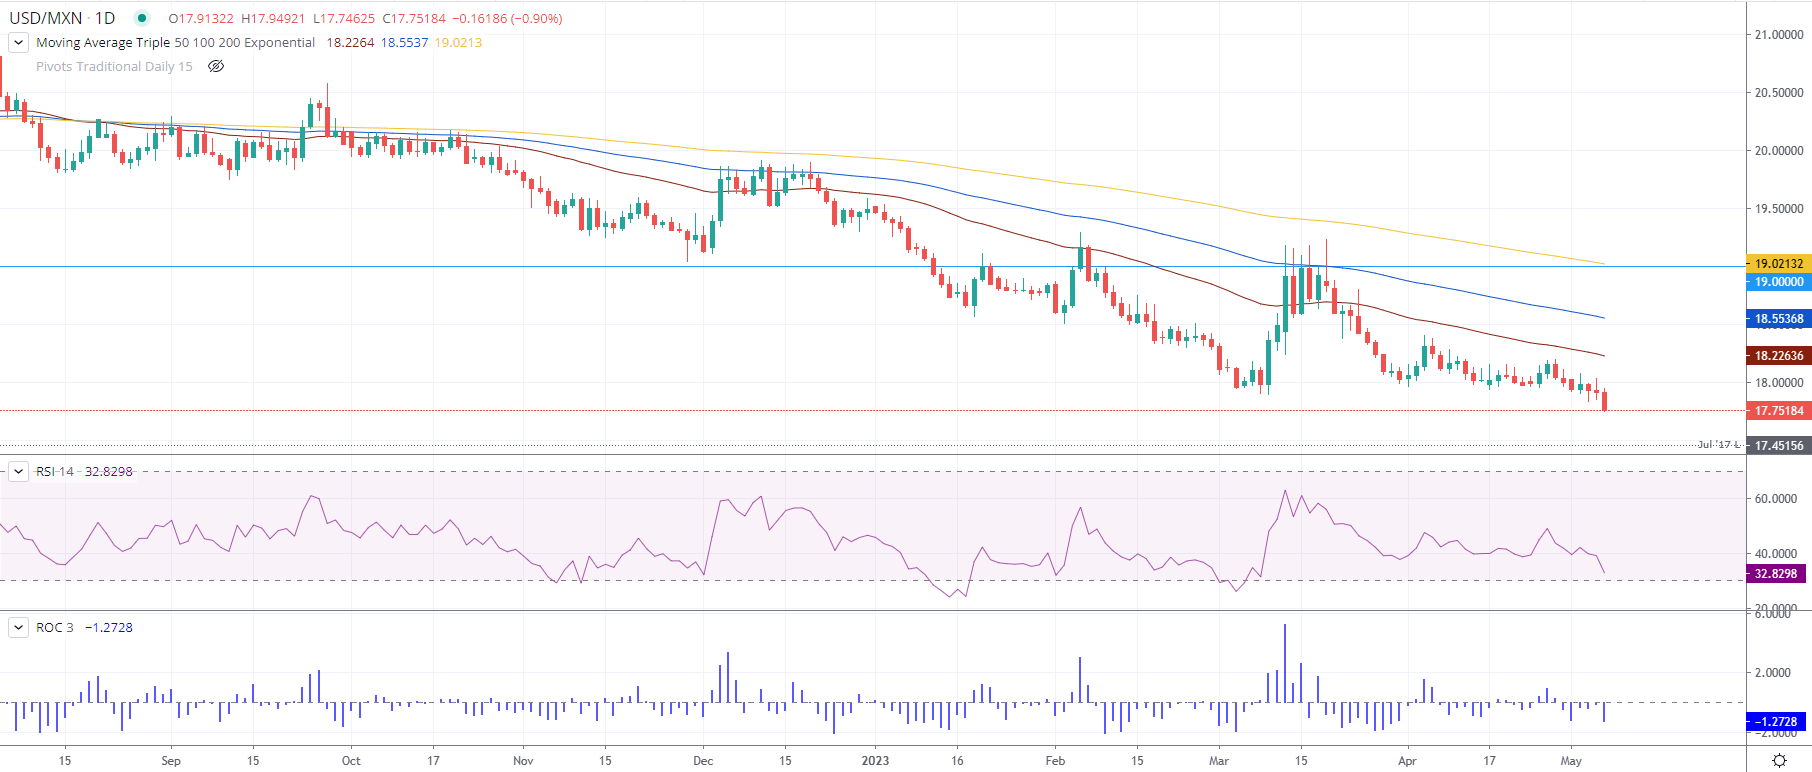
  • USD/MXN eyes 17.5000 support; bullish potential remains limited, with key resistance at 17.9492 and 18.2263.

The USD/MXN fell to fresh six-year lows of 17.7462, hit in the middle of the New York session even though the US economy revealed upbeat data, which failed to strengthen the US Dollar (USD). At the time of writing, the USD/MXN pair is trading at 17.7480, down 0.92%.

A goodish employment report in the United States (US) improved market sentiment. Therefore, high beta currencies, alongside emerging markets peers, advanced sharply against their counterpart, the US Dollar.

USD/MXN Price Action

The USD/MXN pair remains in a strong downtrend, registering more than 9% losses from year-to-date (YTD). Notably, since the USD/MXN pair fell below the 19.00 figure, the USD/MXN has tested the level for ten days, though buyers could not crack it. In fact, traders remain short in the USD/MXN pair, even though speculations around the Bank of Mexico’s (Banxico) pausing its tightening cycle in May, have not triggered outflows from the emerging market currency.

Momentum indicators, like the Relative Strength Index (RSI), remain to push downwards, with space before turning oversold. The 3-day Rate of Change (RoC) shifted neutral and resumed to the downside as sellers stepped in. Therefore, the USD/MXN path of least resistance is downwards.

That said, the USD/MXN next support would be 17.5000. A breach of the latter will expose the July 2017 swing low of 17.4515 before dropping to 17.0000.

Conversely, if USD/MXN reclaims the May 5 daily high of 17.9492, that could form a bullish-engulfing candle pattern, which could warrant further upside. The buyer’s next stop would be 18.00, followed by the 50-day Exponential Moving Average (EMA) at 18.2263.

USD/MXN Daily Chart

USD/MXN Daily chart

USD/MXN

Overview
Today last price17.7568
Today Daily Change-0.1560
Today Daily Change %-0.87
Today daily open17.9128
 
Trends
Daily SMA2018.0353
Daily SMA5018.232
Daily SMA10018.6088
Daily SMA20019.2442
 
Levels
Previous Daily High18.0358
Previous Daily Low17.853
Previous Weekly High18.2
Previous Weekly Low17.9511
Previous Monthly High18.4018
Previous Monthly Low17.9329
Daily Fibonacci 38.2%17.9228
Daily Fibonacci 61.8%17.966
Daily Pivot Point S117.832
Daily Pivot Point S217.7511
Daily Pivot Point S317.6492
Daily Pivot Point R118.0147
Daily Pivot Point R218.1166
Daily Pivot Point R318.1975
 

Author

Christian Borjon Valencia

Christian Borjon began his career as a retail trader in 2010, mainly focused on technical analysis and strategies around it. He started as a swing trader, as he used to work in another industry unrelated to the financial markets.

More from Christian Borjon Valencia
Share:

Markets move fast. We move first.

Orange Juice Newsletter brings you expert driven insights - not headlines. Every day on your inbox.

By subscribing you agree to our Terms and conditions.

Editor's Picks

EUR/USD recovers to 1.1750 region as 2025 draws to a close

Following the bearish action seen in the European session on Wednesday, EUR/USD regains its traction and recovery to the 1.1750 region. Nevertheless, the pair's volatility remains low as trading conditions thin out on the last day of the year.

GBP/USD stays weak near 1.3450 on modest USD recovery

GBP/USD remains under modest beairsh pressure and fluctuates at around 1.3450 on Wednesday. The US Dollar finds fresh demand due to the end-of-the-year position adjustments, weighing on the pair amid the pre-New Year trading lull. 

Gold retreats to $4,300 area, looks to post monthly gains

Gold stays on the back foot on the last day of 2025 and trades near $4,300, possibly pressured by profit-taking and position adjustments. Nevertheless, XAU/USD remains on track to post gains for December and extend its winning streak into a fifth consecutive month.

Bitcoin, Ethereum and XRP prepare for a potential New Year rebound

Bitcoin, Ethereum, and Ripple are holding steady on Wednesday after recording minor gains on the previous day. Technically, Bitcoin could extend gains within a triangle pattern while Ethereum and Ripple face critical overhead resistance. 

Economic outlook 2026-2027 in advanced countries: Solidity test

After a year marked by global economic resilience and ending on a note of optimism, 2026 looks promising and could be a year of solid economic performance. In our baseline scenario, we expect most of the supportive factors at work in 2025 to continue to play a role in 2026.

Crypto market outlook for 2026

Year 2025 was volatile, as crypto often is.  Among positive catalysts were favourable regulatory changes in the U.S., rise of Digital Asset Treasuries (DAT), adoption of AI and tokenization of Real-World-Assets (RWA).