|

USD/MXN Price Analysis: Pares the biggest daily loss in a year around 18.60

  • USD/MXN remains sidelined near one-week-old ascending support line after falling the most since March 2022.
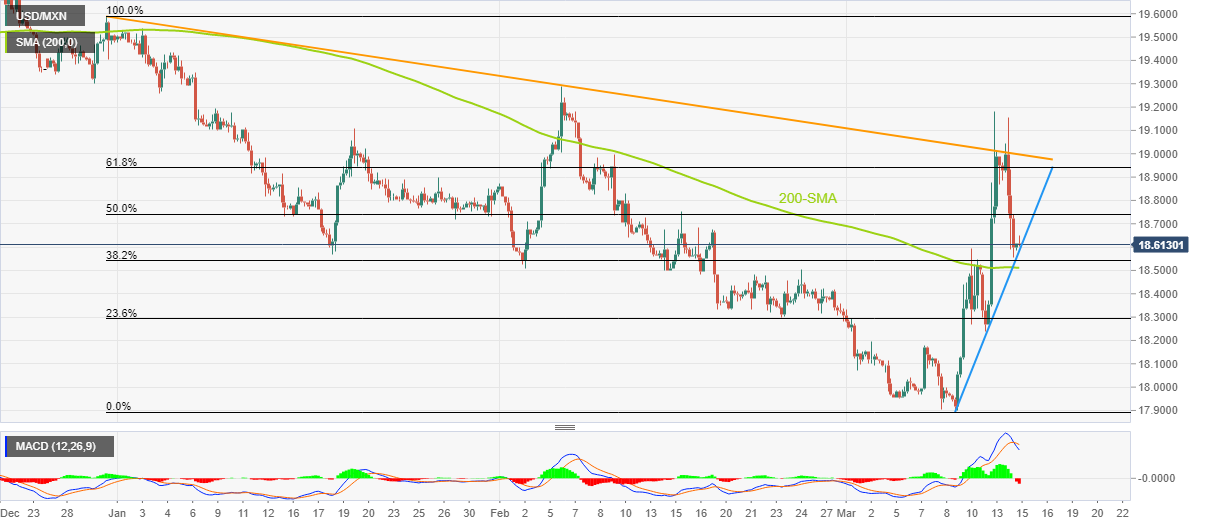
  • Clear U-turn from 2.5-month-old descending resistance line, bearish MACD signals keep sellers hopeful.
  • 200-SMA acts as an extra filter towards the south.

USD/MXN holds lower ground near 18.61 as bears poke one-week-old ascending support line during early Wednesday. In doing so, the Mexican Peso (MXN) pair justifies the bearish MACD signals, as well as the quote’s U-turn from a downward-sloping resistance line from December 30, 2022.

It’s worth noting that the 200-SMA level surrounding 18.50 acts as additional support, other than the aforementioned trend line of near 18.60.

In a case where USD/MXN remains weak past 18.50, the odds of witnessing a slump towards the weekly low near 18.20 and then to the March 07 peak of 18.17 can’t be ruled out.

Should the MXN pair manage to conquer the 18.17 support, the bears can quickly approach the 18.00 psychological magnet before eyeing the monthly low of 17.90, also the lowest levels since October 2018.

On the contrary, USD/MXN recovery could initially aim for the 50% and 61.8% Fibonacci retracement level of the pair’s declines from late December 2022 to early March 2023, respectively near 18.75 and 18.95 in that order.

However, the pair buyers remain off the table unless successfully cross the multi-day-old resistance line, around the 19.00 round figure.

Overall, USD/MXN is likely to remain bearish even as the downside room appears limited.

USD/MXN: Four-hour chart

Trend: Further downside expected

Additional important levels

Overview
Today last price18.6173
Today Daily Change0.0169
Today Daily Change %0.09%
Today daily open18.6004
 
Trends
Daily SMA2018.3393
Daily SMA5018.659
Daily SMA10019.1002
Daily SMA20019.6379
 
Levels
Previous Daily High19.1545
Previous Daily Low18.5556
Previous Weekly High18.5957
Previous Weekly Low17.8977
Previous Monthly High19.2901
Previous Monthly Low18.2954
Daily Fibonacci 38.2%18.7844
Daily Fibonacci 61.8%18.9257
Daily Pivot Point S118.3858
Daily Pivot Point S218.1713
Daily Pivot Point S317.787
Daily Pivot Point R118.9847
Daily Pivot Point R219.369
Daily Pivot Point R319.5836

Author

Anil Panchal

Anil Panchal

FXStreet

Anil Panchal has nearly 15 years of experience in tracking financial markets. With a keen interest in macroeconomics, Anil aptly tracks global news/updates and stays well-informed about the global financial moves and their implications.

More from Anil Panchal
Share:

Markets move fast. We move first.

Orange Juice Newsletter brings you expert driven insights - not headlines. Every day on your inbox.

By subscribing you agree to our Terms and conditions.

Editor's Picks

EUR/USD struggles for direction amid USD gains

EUR/USD is trimming part of its earlier gains, coming under some mild downside pressure near 1.1730 as the US Dollar edges higher. Markets are still digesting the Fed’s latest rate decision, while also looking ahead to more commentary from Fed officials in the sessions ahead.

GBP/USD drops to daily lows near 1.3360

Disappointing UK data weighed on the Sterling towards the end of the week, triggering a pullback in GBP/USD to fresh daily lows near 1.3360. Looking ahead, the next key event across the Channel is the BoE meeting on December 18.

Gold losses momentum, challenges $4,300

Gold now gives away some gains and disputes the key $4,300 zone per troy ounce following earlier multi-week highs. The move is being driven by expectations that the Fed will deliver further rate cuts next year, with the yellow metal climbing despite a firmer Greenback and rising US Treasury yields across the board.

Litecoin Price Forecast: LTC struggles to extend gains, bullish bets at risk

Litecoin (LTC) price steadies above $80 at press time on Friday, following a reversal from the $87 resistance level on Wednesday. Derivatives data suggests a bullish positional buildup while the LTC futures Open Interest declines, flashing a long squeeze risk.

Big week ends with big doubts

The S&P 500 continued to push higher yesterday as the US 2-year yield wavered around the 3.50% mark following a Federal Reserve (Fed) rate cut earlier this week that was ultimately perceived as not that hawkish after all. The cut is especially boosting the non-tech pockets of the market.

Aave Price Forecast: AAVE primed for breakout as bullish signals strengthen

Aave (AAVE) price is trading above $204 at the time of writing on Friday and approaching the upper boundary of its descending parallel channel; a breakout from this structure would favor the bulls.