|

USD/MXN Price Analysis: Pair remains sideways ahead of US data, hovers around 16.75

  • USD/MXN consolidates before the release of the US economic data.
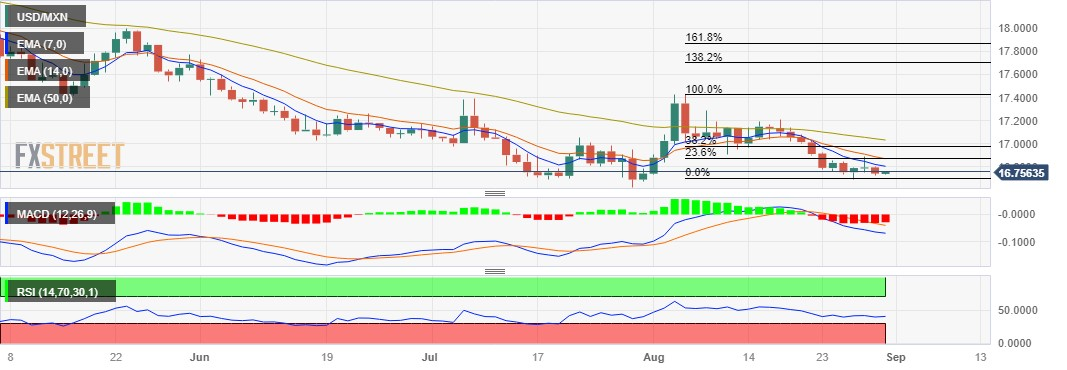
  • Seven-day EMA appears to be the immediate resistance aligned to both 14-day EMA and 23.6% Fibo.
  • MACD indicates that recent momentum is weaker.

USD/MXN hovers around 16.75 ahead of the European session kicking off on Thursday. The pair witnessed downward pressure due to the moderate data from Mexico and cautious sentiment ahead of the US Federal Reserve’s (Fed) preferred inflation gauge, notably the US Core Personal Consumption Expenditure (PCE) Price Index for August.

The seven-day Exponential Moving Average (EMA) at 16.80 emerges as the immediate barrier lined up with both 14-day EMA and 23.6% Fibonacci retracement at 16.87. A firm break above the latter could open the doors for the USD/MXN pair to explore the region around 38.2% Fibonacci retracement at 16.97.

On the flip side, the pair could meet the key support around the monthly low at 16.69 level, followed by July’s low at 16.62 level. A break below that level could inspire the bears of the pair to navigate the region around a 16.50 psychological level.

The 14-day Relative Strength Index (RSI) remains below 50, indicating a bearish bias of the USD/MXN traders. The Moving Average Convergence Divergence (MACD) line remains below the centerline and shows the divergence below the signal line, which indicates that recent momentum is weaker.

In the short term, the underlying trend remains bearish as long as the USD/MXN pair stays below the 50-day EMA at 17.07.

USD/MXN: Daily Chart

USD/MXN: additional important levels

Overview
Today last price16.7607
Today Daily Change0.0188
Today Daily Change %0.11
Today daily open16.7419
 
Trends
Daily SMA2016.9965
Daily SMA5016.9766
Daily SMA10017.3237
Daily SMA20018.0877
 
Levels
Previous Daily High16.8036
Previous Daily Low16.7269
Previous Weekly High17.08
Previous Weekly Low16.7366
Previous Monthly High17.3957
Previous Monthly Low16.6258
Daily Fibonacci 38.2%16.7562
Daily Fibonacci 61.8%16.7743
Daily Pivot Point S116.7114
Daily Pivot Point S216.6808
Daily Pivot Point S316.6347
Daily Pivot Point R116.788
Daily Pivot Point R216.8341
Daily Pivot Point R316.8646

Author

Akhtar Faruqui

Akhtar Faruqui is a Forex Analyst based in New Delhi, India. With a keen eye for market trends and a passion for dissecting complex financial dynamics, he is dedicated to delivering accurate and insightful Forex news and analysis.

More from Akhtar Faruqui
Share:

Editor's Picks

GBP/USD bounces off lows, back above 1.3200

After bottoming out near 1.3160, GBP/USD manages to regain a bit of shine and reclaim the 1.3200 mark and beyond at the end of the week. Stronger-than-expected UK Retail Sales data seem to be helping the British Pound limit its losses, while the chaotic UK political environment keeps the bulls at bay for now.

EUR/USD looks consolidative around 1.1460

EUR/USD stages a modest rebound after slipping to a three-month low below 1.1420 at the end of the week. That said, the pair now looks to consolidate humble gains just above 1.1460 despite growing uncertainty surrounding the next round of US-Iran negotiations, which keeps the US Dollar’s downside contained.

Gold slips back to six-day lows, targets $4,100

Gold retreats for the third consecutive day on Friday, eroding gains seen in the first half of the week and approaching the key $4,100 mark per troy ounce. Indeed, the precious metal continues to face headwinds from the Fed's hawkish stance and renewed uncertainty surrounding the next round of US-Iran negotiations.

Breaking: Iran closes the Strait of Hormuz amid ceasefire deal violation
Iran says it is closing the Strait of Hormuz after accusing the United States (US) and Israel of violating the ceasefire. According to Iran, the decision came over the continued Israeli strikes in Lebanon. The Iranian Revolutionary Guard Corps Navy issued a warning to all vessels: "Do not approach the Strait of Hormuz; otherwise, your security will be jeopardized."
The Iran war didn't break the US economy, but what happens next?

Nearly four months after the start of the Iran war, the US economy remains remarkably resilient. While the conflict initially triggered a severe disruption to global energy markets and a sharp rise in Oil prices, recent diplomatic progress between Washington and Tehran has eased concerns about a prolonged supply shock.

Regime change: Inside Kevin Warsh's first move to make the Fed unreadable on purpose

The rate did not move. That was the least interesting thing about Kevin Warsh's first meeting in charge of the Fed. The FOMC held its benchmark at 3.50%-3.75% for the fourth straight meeting, exactly as priced, and then the new chair used his first press conference to dismantle the machinery the market has leaned on for a decade.