|

USD/MXN Price Analysis: Mexican Peso bears attack 17.69 confluence level

  • USD/MXN picks up bids to extend previous recovery from fortnight low.
  • Convergence of 100-HMA, one-week-old descending trend line prod pair buyers.
  • 200-HMA acts as additional hurdle for Mexican Peso sellers.
  • Two-week-old horizontal support is the key for pair bears to conquer.

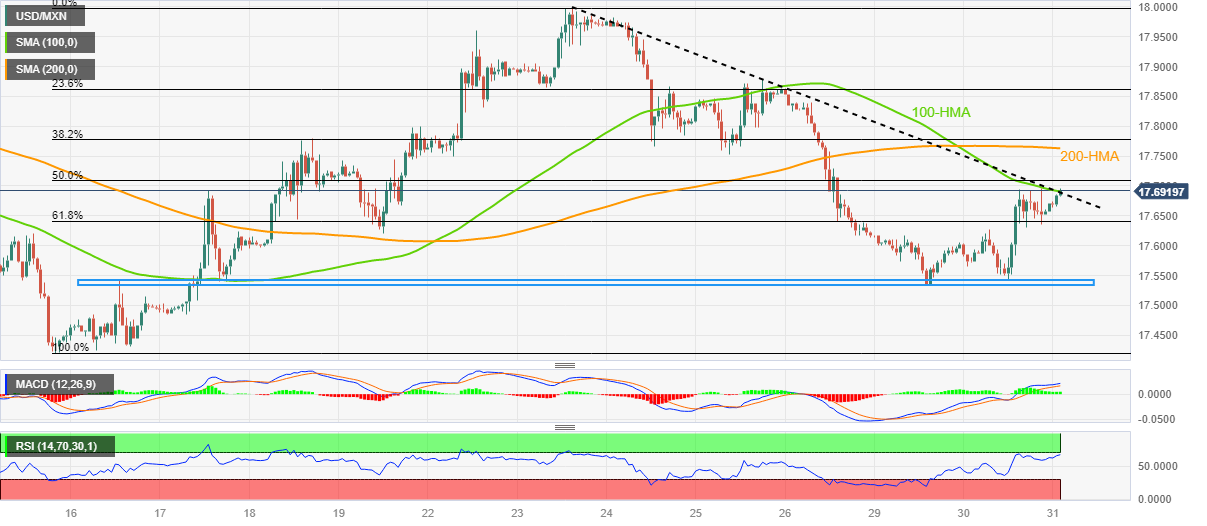
USD/MXN holds onto the previous day’s recovery from a two-week low as bulls poke a 17.69 resistance confluence during early Wednesday.

In doing so, the Mexican Peso (MXN) pair struggles to extend recovery from a fortnight-long horizontal support while jostling with the short-term key upside hurdle comprising the 100-Hour Moving Average (HMA) and a one-week-old descending trend line.

It’s worth noting that the overbought RSI (14) conditions challenge the USD/MXN buyers around the 17.69 resistance confluence.

Even if the quote crosses the 17.69 key resistance, the 17.70 round figure and the 200-HMA level of 17.76 may act as extra filters toward the north ahead of directing the pair buyers toward the monthly peak of near the 18.00 round figure.

Alternatively, the USD/MXN pair’s pullback remains elusive unless the quote stays beyond the 61.8% Fibonacci retracement level of May 15-23 upside, near 17.64 at the latest.

Should the quote drops below 17.64, it can drop to the aforementioned two-week-old horizontal support zone surrounding 17.54-53.

The USD/MXN pair’s south-run towards the multi-month low marked earlier in May around 17.42 and the year 2016 low of near 17.05 can’t be ruled out.

USD/MXN: Hourly chart

Trend: Limited upside expected

Additional important levels

Overview
Today last price17.6923
Today Daily Change0.0354
Today Daily Change %0.20%
Today daily open17.6569
 
Trends
Daily SMA2017.7172
Daily SMA5017.9675
Daily SMA10018.2927
Daily SMA20019.0207
 
Levels
Previous Daily High17.6936
Previous Daily Low17.5411
Previous Weekly High17.9981
Previous Weekly Low17.6165
Previous Monthly High18.4018
Previous Monthly Low17.9329
Daily Fibonacci 38.2%17.6354
Daily Fibonacci 61.8%17.5994
Daily Pivot Point S117.5675
Daily Pivot Point S217.478
Daily Pivot Point S317.415
Daily Pivot Point R117.72
Daily Pivot Point R217.7831
Daily Pivot Point R317.8725

Author

Anil Panchal

Anil Panchal

FXStreet

Anil Panchal has nearly 15 years of experience in tracking financial markets. With a keen interest in macroeconomics, Anil aptly tracks global news/updates and stays well-informed about the global financial moves and their implications.

More from Anil Panchal
Share:

Markets move fast. We move first.

Orange Juice Newsletter brings you expert driven insights - not headlines. Every day on your inbox.

By subscribing you agree to our Terms and conditions.

Editor's Picks

EUR/USD moves sideways below 1.1800 on Christmas Eve

EUR/USD struggles to find direction and trades in a narrow channel below 1.1800 after posting gains for two consecutive days. Bond and stock markets in the US will open at the usual time and close early on Christmas Eve, allowing the trading action to remain subdued. 

GBP/USD keeps range around 1.3500 amid quiet markets

GBP/USD keeps its range trade intact at around 1.3500 on Wednesday. The Pound Sterling holds the upper hand over the US Dollar amid pre-Christmas light trading as traders move to the sidelines heading into the holiday season. 

Gold retreats from record highs, trades below $4,500

Gold retreats after setting a new record-high above $4,520 earlier in the day and trades in a tight range below $4,500 as trading volumes thin out ahead of the Christmas break. The US Dollar selling bias remains unabated on the back of dovish Fed expectations, which continues to act as a tailwind for the bullion amid persistent geopolitical risks.

Bitcoin slips below $87,000 as ETF outflows intensify, whale participation declines

Bitcoin price continues to trade around $86,770 on Wednesday, after failing to break above the $90,000 resistance. US-listed spot ETFs record an outflow of $188.64 million on Tuesday, marking the fourth consecutive day of withdrawals.

Economic outlook 2026-2027 in advanced countries: Solidity test

After a year marked by global economic resilience and ending on a note of optimism, 2026 looks promising and could be a year of solid economic performance. In our baseline scenario, we expect most of the supportive factors at work in 2025 to continue to play a role in 2026.

Avalanche struggles near $12 as Grayscale files updated form for ETF

Avalanche trades close to $12 by press time on Wednesday, extending the nearly 2% drop from the previous day. Grayscale filed an updated form to convert its Avalanche-focused Trust into an ETF with the US Securities and Exchange Commission.