- Mexican peso rises for the third-week in-a-row against the US dollar.
- USD/MXN outlook remains bearish, finds support at 19.60.
The USD/MXN pair dropped on Friday to 19.60, hitting the lowest level intraday level since November 7. It is about to end the week moving sideways between 19.60 and 19.70, consolidating significant weekly losses.
From the peak it reached back in early December, the pair has fallen 4.5% becoming the MXN, the best performer following the presentation of the Mexican 2018 budget, a rate hike from Banxico and a recovery in Mexican bonds.
During the week, the Mexican peso, as well as other emerging market currencies, remained resilient despite the shard slide in equity price in Wall Street. “In this context, emerging market assets registered a mixed performance: across regions, LatAm underperformed due to oil prices, with the main exceptions of the MXN, which apart from the weak USD also benefited from easing idiosyncratic concerns. Regarding EM assets, equity indices registered a mixed performance, while credit references continued to deteriorate across the board with the EMBI spread at its highest level since 2016”, said BBVA analysts. The Argentinean peso was the exception in the region, falling almost 1% over the week versus the US dollar.
USD/MXN Levels to watch
The current tone from the chart and the momentum favor the downside. From a fundamental perspective, many risks are still there, like Trump’s trade and immigration policies, the Mexican and the global economic outlook, tensions across financial markets and uncertainty about the Andres Manuel Lopez Obrador policies.
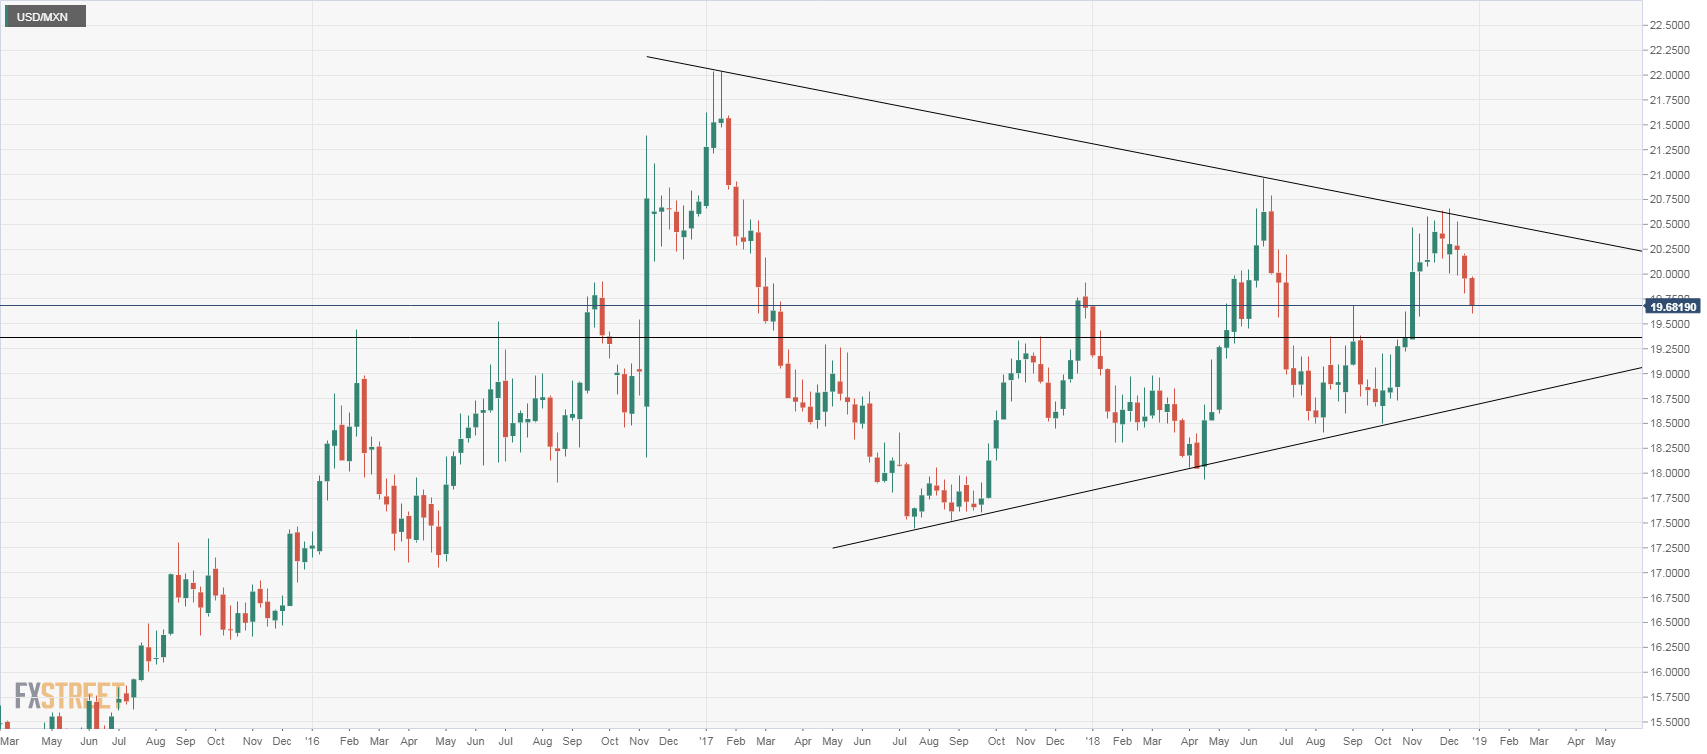
The weekly chart shows the pair with a clear bearish bias, retreating after finding resistance at a long-term downtrend line. The slide could continue over the next weeks to the 19.35/40 area that is a strong support area. A break lower would expose 19.00 and an uptrend line at 18.65.
If the US dollar recovers, in the short-term resistance levels, are seen at 20.00 and 20.20. Above, the 20.50/55 is the critical area to watch, a horizontal level and the downtrend line. A break higher would clear the way for a rally to 21.00.
Information on these pages contains forward-looking statements that involve risks and uncertainties. Markets and instruments profiled on this page are for informational purposes only and should not in any way come across as a recommendation to buy or sell in these assets. You should do your own thorough research before making any investment decisions. FXStreet does not in any way guarantee that this information is free from mistakes, errors, or material misstatements. It also does not guarantee that this information is of a timely nature. Investing in Open Markets involves a great deal of risk, including the loss of all or a portion of your investment, as well as emotional distress. All risks, losses and costs associated with investing, including total loss of principal, are your responsibility. The views and opinions expressed in this article are those of the authors and do not necessarily reflect the official policy or position of FXStreet nor its advertisers. The author will not be held responsible for information that is found at the end of links posted on this page.
If not otherwise explicitly mentioned in the body of the article, at the time of writing, the author has no position in any stock mentioned in this article and no business relationship with any company mentioned. The author has not received compensation for writing this article, other than from FXStreet.
FXStreet and the author do not provide personalized recommendations. The author makes no representations as to the accuracy, completeness, or suitability of this information. FXStreet and the author will not be liable for any errors, omissions or any losses, injuries or damages arising from this information and its display or use. Errors and omissions excepted.
The author and FXStreet are not registered investment advisors and nothing in this article is intended to be investment advice.
Recommended content
Editors’ Picks
EUR/USD extends losses on dovish remarks from ECB members, trades near 1.0780
EUR/USD continues its downward trend for the fourth consecutive day, driven by a stronger US Dollar influenced by the hawkish market sentiment surrounding the Federal Reserve and expectations of prolonged higher interest rates.
GBP/USD trades sideways above 1.2600 amid quiet session
The GBP/USD pair trades sideways around 1.2622 during the early Friday. The market is likely to be mute in light trading on Good Friday. Later in the day, the US Core Personal Consumption Expenditures Price Index will be released.
Gold ends Q1 2024 at record highs, what’s next?
Gold is sitting at an all-time high of $2,236, lacking a trading impetus amid holiday-thinned conditions on Good Friday. Most major world markets, including the United States are closed in observance of Holy Friday, leaving volatility around Gold price highly subdued.
Ripple's move above this key level could trigger nearly 50% rally for XRP
Ripple price has overcome a critical resistance level and flipped into a support floor on the weekly time frame. This development happened while XRP tightly consolidated for roughly 250 days. As this coiling up comes undone, investors can expect XRP to kickstart a massive rally.
Will they won’t they cut rates is the question of Q2?
There has been some significant push back from Fed and Bank of England members around the timing of rate cuts, and the Bank of Japan still haven’t physically intervened in the FX market to stem yen weakness although they are threatening to do so.