|

USD/MXN extends slide below 19.50, to lowest in two weeks

  • Mexican Peso accelerates the upside versus US Dollar after breaking key technical level.
  • US data in line with expectations, Mexican activity stagnates in October.

The USD/MXN broke under 19.50 and quickly fell further hitting 19.40, for the first time since December 5. The pair remains near the low, under pressure as the US Dollar posts mixed results on Friday.

Economic data from the US showed the Core Personal Consumption Expenditure Price Index rose 0.2% in November, in line with expectations. A different report showed Durable Goods Orders dropped 2.1%, against expectation of a 0.6% slide. The numbers did not have a significant influence on the US Dollar.

In Mexico, the Economic Activity index stagnated in October, against expectations of a 0.3% increase. Compared to a year earlier, the index rose 4.40%. On Thursday, inflation that came in mixed with the headline index rising after six consecutive drops (from 7.46% to 7.77%), while the core rate slowed down (8.37% to 8.35%).
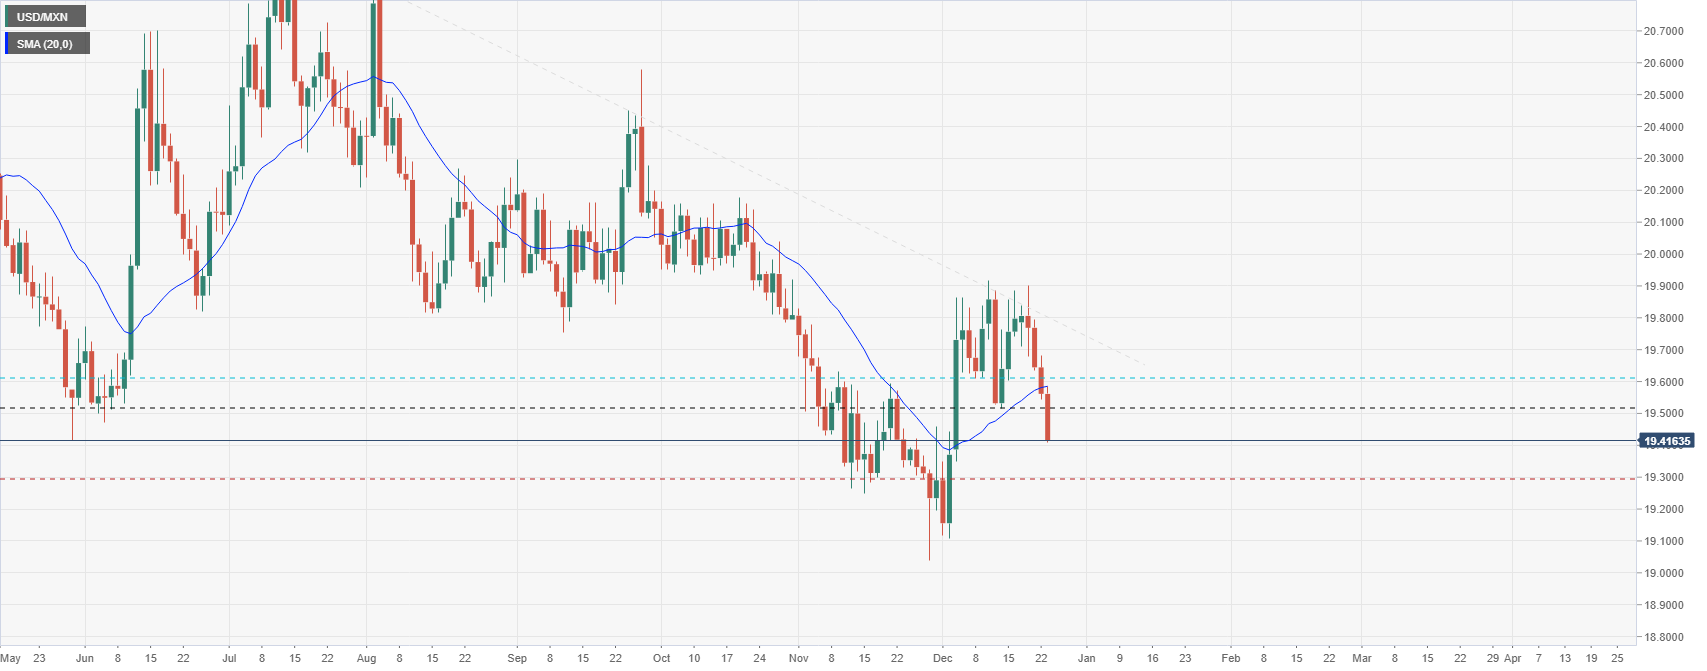
Levels to watch

The consolidation below 19.70 left the USD/MXN vulnerable to more losses. Recently it broke the 19.50 support area falling to as low as 19.40. The bearish bias prevails with the next relevant support at 19.30. A recovery back above 19.50 would alleviate the pressure. The next resistance stands at 19.60, with a recovery above adding strength to the US Dollar.

USD/MXN daily chart

USDMXN

USD/MXN

Overview
Today last price19.4285
Today Daily Change-0.1330
Today Daily Change %-0.68
Today daily open19.5615
 
Trends
Daily SMA2019.581
Daily SMA5019.6317
Daily SMA10019.8418
Daily SMA20020.0025
 
Levels
Previous Daily High19.682
Previous Daily Low19.5423
Previous Weekly High19.9181
Previous Weekly Low19.5169
Previous Monthly High19.8281
Previous Monthly Low19.0402
Daily Fibonacci 38.2%19.5957
Daily Fibonacci 61.8%19.6286
Daily Pivot Point S119.5085
Daily Pivot Point S219.4556
Daily Pivot Point S319.3689
Daily Pivot Point R119.6482
Daily Pivot Point R219.735
Daily Pivot Point R319.7879

Author

Matías Salord

Matías started in financial markets in 2008, after graduating in Economics. He was trained in chart analysis and then became an educator. He also studied Journalism. He started writing analyses for specialized websites before joining FXStreet.

More from Matías Salord
Share:

Editor's Picks

AUD/USD falls to near 0.7100 after slipping below 50-day EMA

AUD/USD depreciates after registering minor gains in the previous day, trading around 0.7120 during the Asian hours. The technical analysis of the daily chart shows the pair consolidating sideways within a rectangle pattern, as neither bulls nor bears gain control. The AUD/USD pair is holding a slight bearish tone however as it sits beneath both the nine-day and 50-day EMAs.

160.00: USD/JPY back near intervention territory after upbeat US jobs report

US Nonfarm Payrolls beat expectations by a wide margin in May, with 172K jobs added. The US Dollar rebounds after the release, helping USD/JPY recover from its intraday lows. Warnings from Japanese authorities continue to limit upside potential near the 160.00 threshold.

Gold targets $4,300 amid stronger Dollar

Gold faces increasing selling interest and navigates the area of three-month lows near the $4,300 mark per troy ounce on Friday. The precious metal’s decline comes as traders assess the stronger-than-expected NFP, while the bid bias in the Greenback and higher US Treasury yields also collaborate with the retracement.

Cardano hits five-year low even as Hoskinson clarifies "break" isn't an exit

Cardano (ADA) price is down 10% at press time on Friday, extending losses over 30% so far this week amid Charles Hoskinson's clarification that "break" isn't an exit.

Week ahead – Fed countdown begins amid US inflation data and geopolitical risks

Fed Chair Warsh’s first meeting approaches as key US inflation data could reshape expectations. Oil prices remain elevated as US-Iran talks continue; tariffs also return to the spotlight. ECB is expected to hike; will it be a one-off move or is July live?

The US economy defies the rules: 100 days into the Oil shock and the recession signal is still missing

More than three months after the start of the Iran war and the resulting disruption to global energy markets, the US economy continues to display remarkable resilience. The conflict has triggered a sharp rise in Oil prices, reignited inflationary pressures and fueled widespread concerns about a potential economic slowdown.